- The Chinese yuan fell to fresh multi-month lows in Asia, dragging the Aussie dollar and other currencies lower with it. So far, however, the drop in the Chinese yuan has not pushed the Japanese yen, possibly because the risk aversion in the S&P 500 futures has put a bid under the anti-risk currency.
- On the daily chart, the USD/JPY fell to the lower edge of the bear flag, currently at 112.10.
- A daily close below that level would confirm a bear flag breakdown – a bearish continuation pattern – which, if confirmed, would signal a continuation of the sell-off from the recent high of 114.55 and would open the doors to levels below 110.00.
- Keep an eye on the CNY as a further slide in the Chinese currency may lead to a deeper sell-off in the equities, leading to a bearish close in the S&P 500 and the USD/JPY pair.
Daily Chart
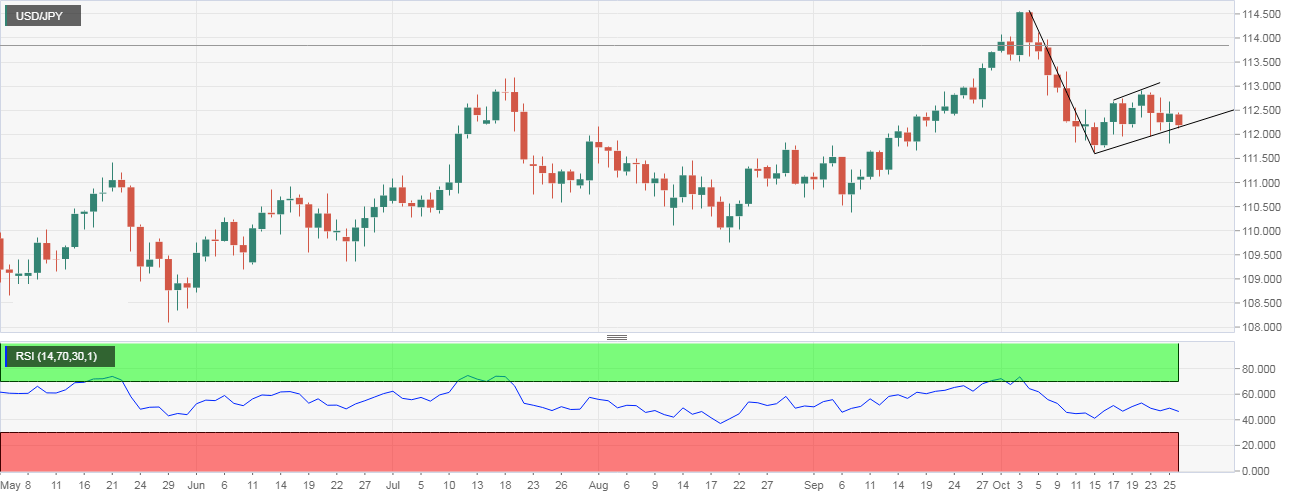
Spot Rate: 112.25
Daily High: 112.44
Daily Low: 112.12
Trend: Bearish below 112.10
Resistance
R1: 112.42 (10-day EMA)
R2: 112.89 (Oct. 22 high)
R3: 113.18 (July high)
Support
S1: 112.10 (flag support)
S2: 111.62 (Oct. 15 low) – 111.57 (100-day EMA)
S3: 110.96 (200-day EMA)
