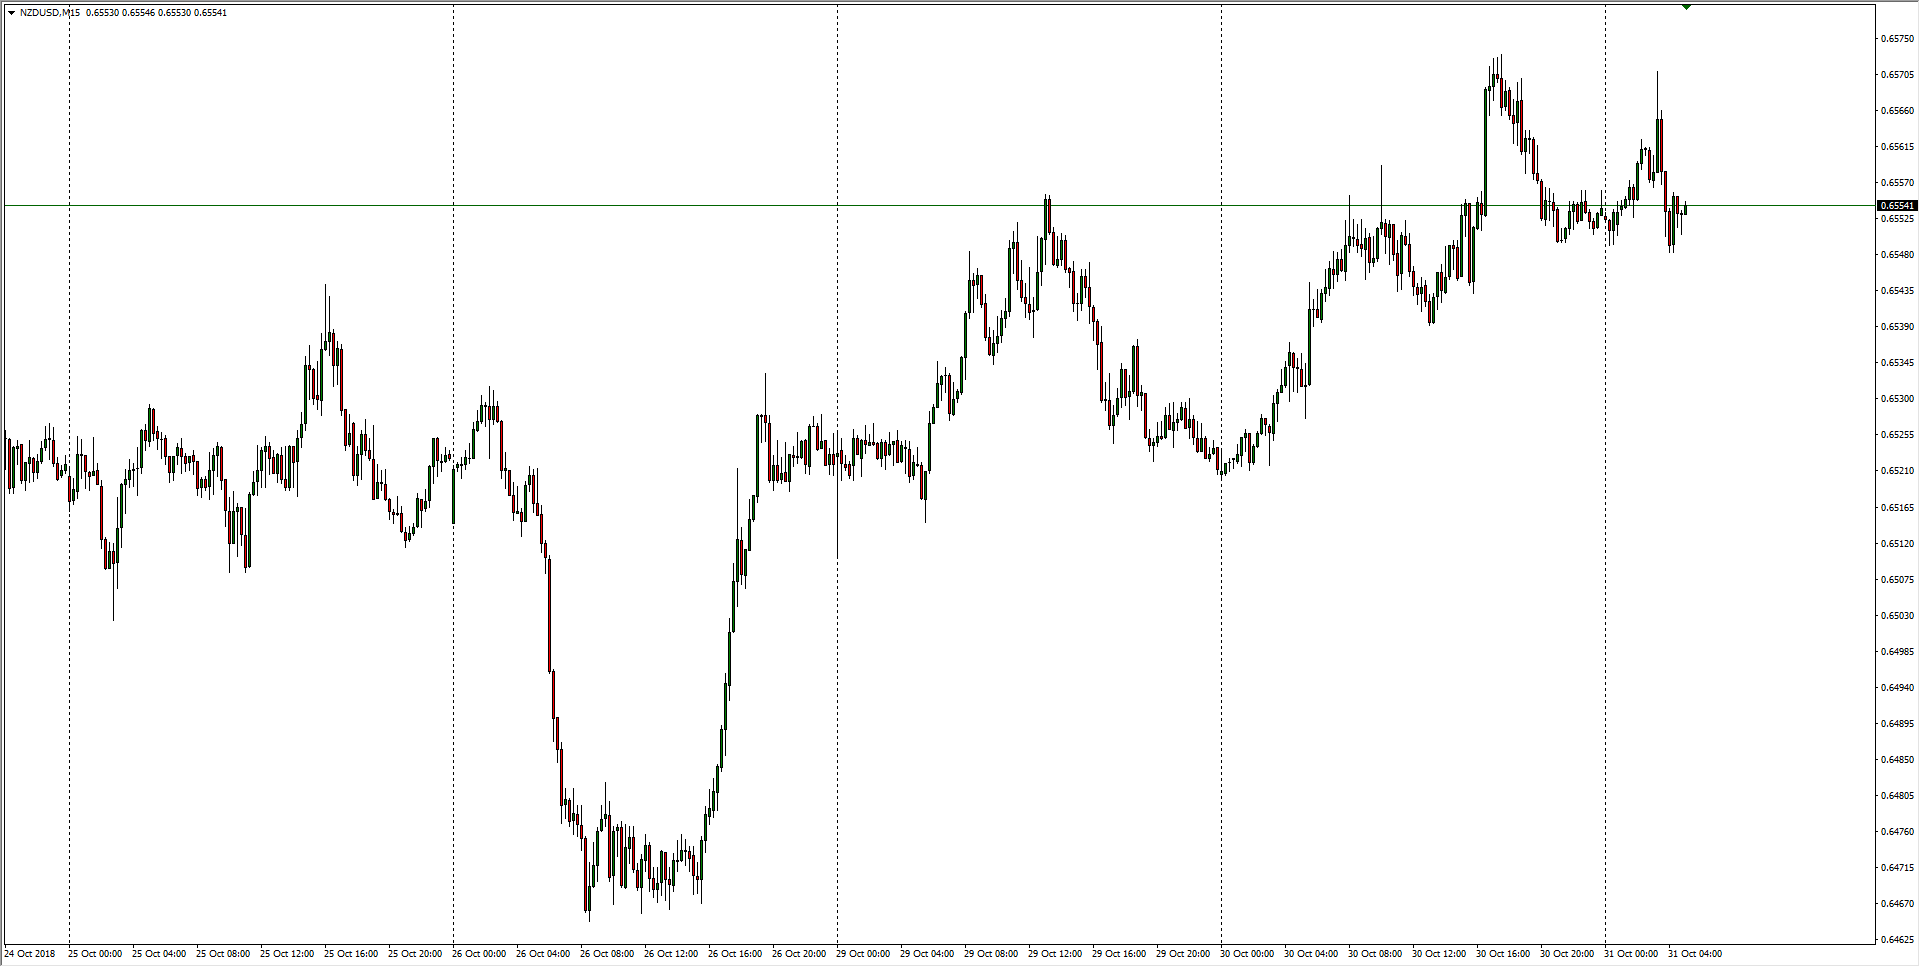
- The NZD/USD is trading towards the high end this week, but the US Dollar index continues to take steps higher across the broader markets, and the Kiwi is remaining constrained near the current week’s peaks at 0.6570.
NZD/USD, M15
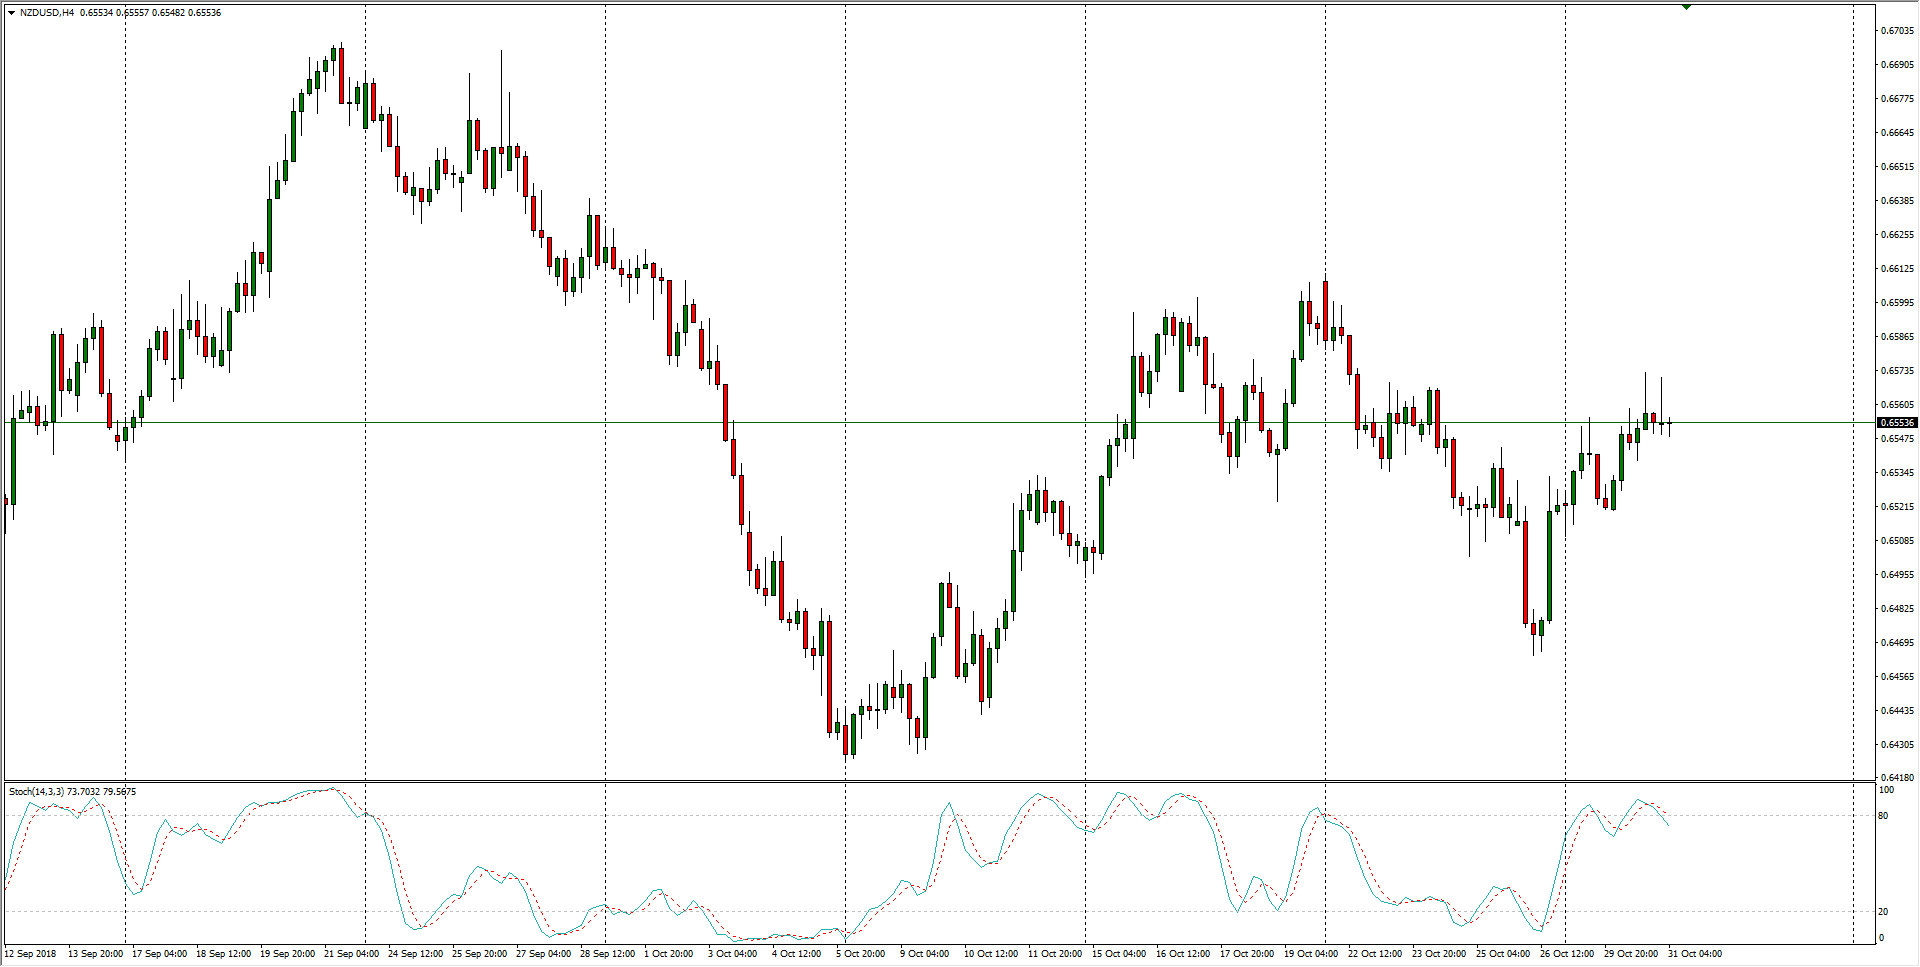
- Moving further up the timeframes, H4 candles show that the Kiwi is currently firming up a sideways wedge pattern, and longer-term traders will be looking to shore up positions at breaks to either side.
NZD/USD, H4
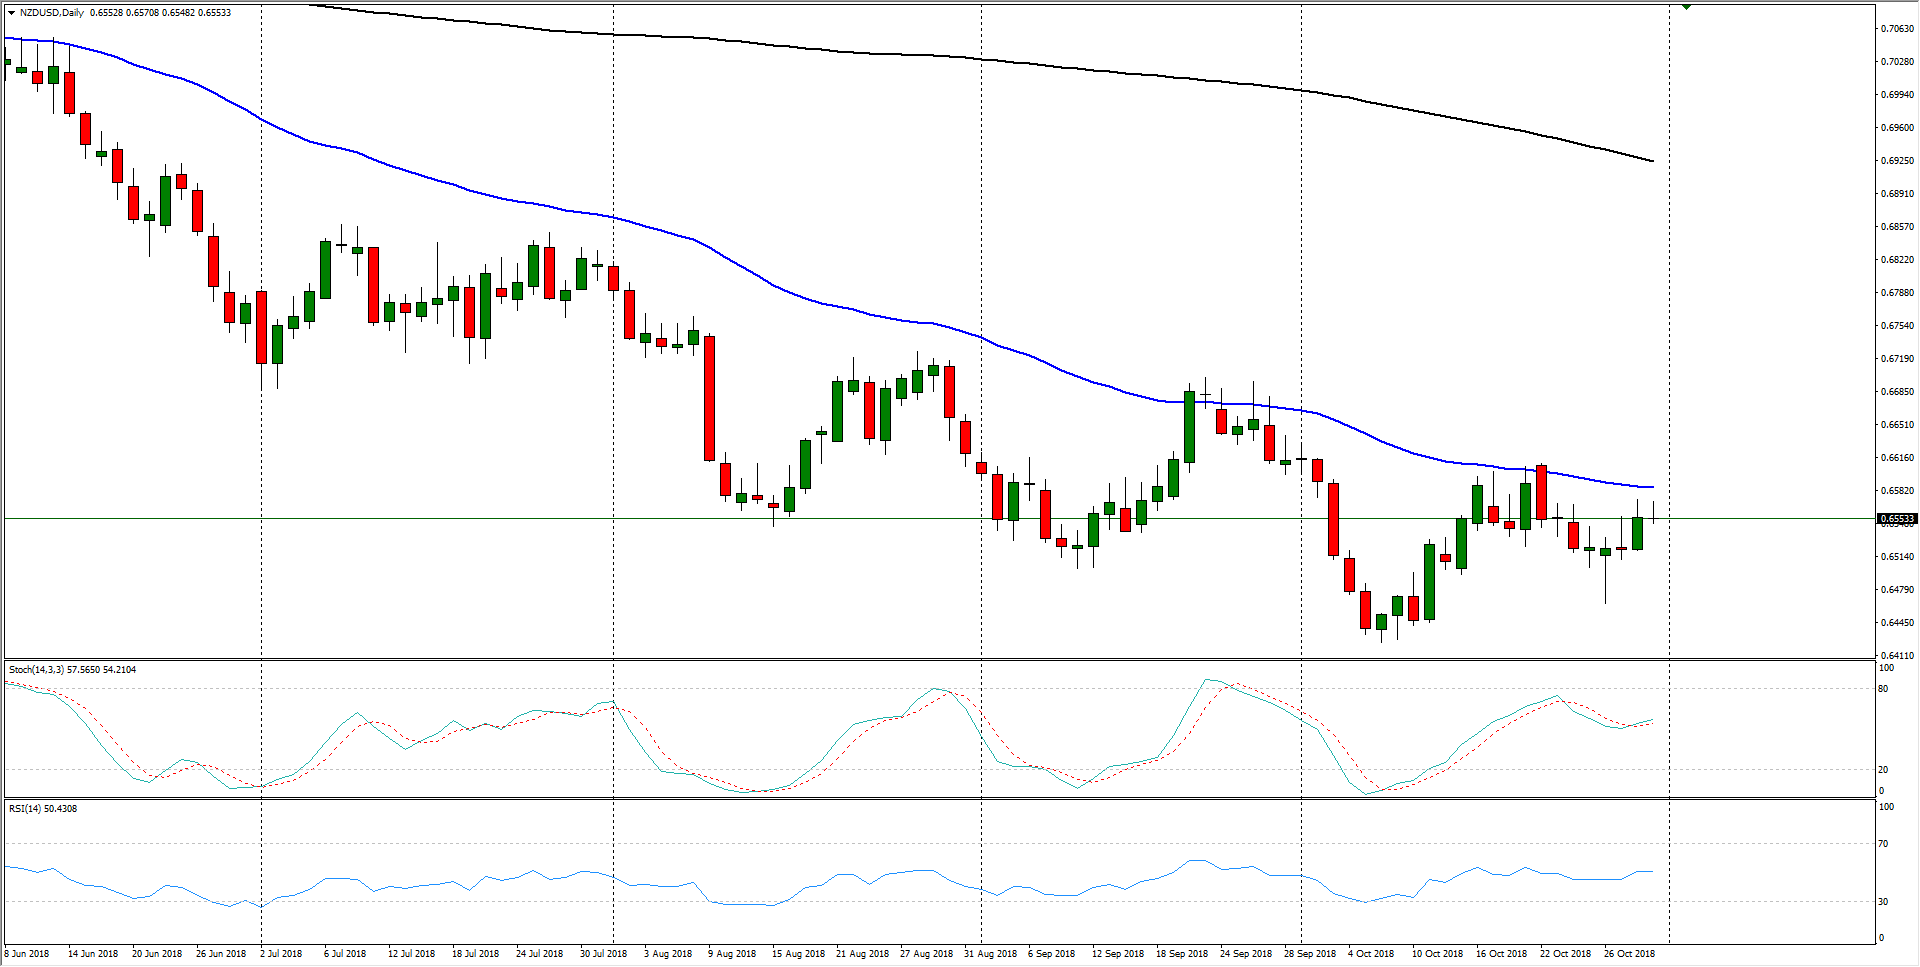
- The past four months sees the NZD/USD holding in a bearish trend, capped off by the still-falling 50-day moving average currently sitting at 0.6585.
NZD/USD, D1
NZD/USD
Overview:
Last Price: 0.6553
Daily change: -1.0 pips
Daily change: -0.0153%
Daily Open: 0.6554
Trends:
Daily SMA20: 0.652
Daily SMA50: 0.6579
Daily SMA100: 0.6678
Daily SMA200: 0.6931
Levels:
Daily High: 0.6574
Daily Low: 0.652
Weekly High: 0.6612
Weekly Low: 0.6465
Monthly High: 0.67
Monthly Low: 0.6501
Daily Fibonacci 38.2%: 0.6554
Daily Fibonacci 61.8%: 0.6541
Daily Pivot Point S1: 0.6525
Daily Pivot Point S2: 0.6496
Daily Pivot Point S3: 0.6471
Daily Pivot Point R1: 0.6579
Daily Pivot Point R2: 0.6604
Daily Pivot Point R3: 0.6633
