- DXY faded the initial optimism and is giving away part of Friday’s gains on the back of a better tone in the risk-associated space.
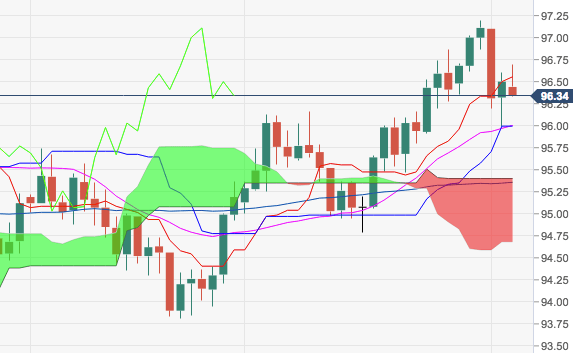
- The earlier bullish attempt run out of steam in the mid-96.00s, where aligns the 10-day SMA. Ideally, the index should retake this area and above to allow a potential new visit to YTD peaks beyond the 97.00 milestone.
- On the downside, strong contention emerges in the 96.00 neighbourhood, where converge recent lows and a Fibo retracement of the 2017-2018 drop.
DXY daily chart
Dollar Index Spot
Overview:
Last Price: 96.34
Daily change: -16 pips
Daily change: -0.166%
Daily Open: 96.5
Trends:
Daily SMA20: 95.99
Daily SMA50: 95.34
Daily SMA100: 95.18
Daily SMA200: 93.17
Levels:
Daily High: 96.6
Daily Low: 95.99
Weekly High: 97.2
Weekly Low: 95.99
Monthly High: 97.2
Monthly Low: 94.79
Daily Fibonacci 38.2%: 96.37
Daily Fibonacci 61.8%: 96.22
Daily Pivot Point S1: 96.13
Daily Pivot Point S2: 95.75
Daily Pivot Point S3: 95.52
Daily Pivot Point R1: 96.74
Daily Pivot Point R2: 96.97
Daily Pivot Point R3: 97.35
