- The index remains on the defensive so far this week, coming under pressure following a pick up in the sentiment surrounding the riskier assets.
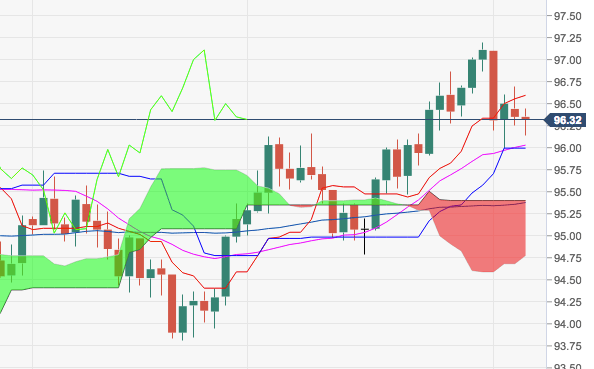
- After the recent drop from YTD peaks above 97.00 the figure, the greenback appears in a consolidative theme albeit always above the 96.00 milestone for the time being.
- On the downside, strong contention emerges in the 96.00 neighbourhood, where converge recent lows and a Fibo retracement of the 2017-2018 drop.
DXY daily chart
Dollar Index Spot
Overview:
Last Price: 96.28
Daily change: -7.0 pips
Daily change: -0.0727%
Daily Open: 96.35
Trends:
Daily SMA20: 96.01
Daily SMA50: 95.38
Daily SMA100: 95.2
Daily SMA200: 93.21
Levels:
Daily High: 96.69
Daily Low: 96.25
Weekly High: 97.2
Weekly Low: 95.99
Monthly High: 97.2
Monthly Low: 94.79
Daily Fibonacci 38.2%: 96.42
Daily Fibonacci 61.8%: 96.52
Daily Pivot Point S1: 96.17
Daily Pivot Point S2: 95.99
Daily Pivot Point S3: 95.73
Daily Pivot Point R1: 96.61
Daily Pivot Point R2: 96.87
Daily Pivot Point R3: 97.05
