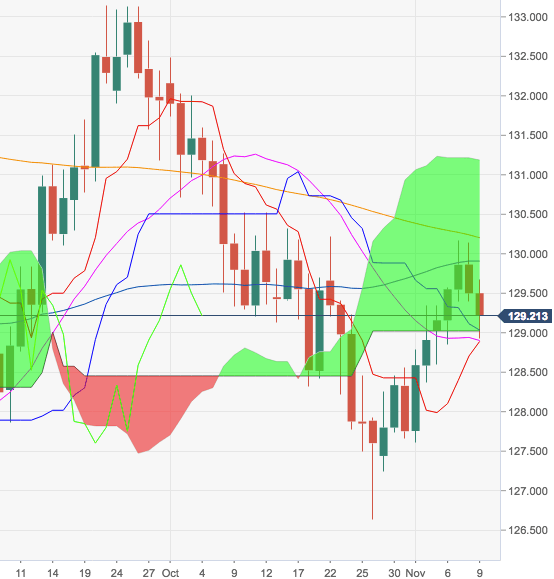
- EUR/JPY is losing ground for the second session in a row in the second half of the week, coming under renewed downside pressure after testing the boundaries of the 200-day SMA earlier in the week.
- In case the selling mood picks up extra pace, the 129.16/128.90 band emerges as initial contention, where align the 21-day SMA and the 10-day SMA.
- A breakdown of this area of support should pave the way for a potential visit to October’s low at 126.62.
EUR/JPY daily chart
EUR/JPY
Overview:
Last Price: 129.15
Daily change: -35 pips
Daily change: -0.270%
Daily Open: 129.5
Trends:
Daily SMA20: 128.89
Daily SMA50: 129.91
Daily SMA100: 129.51
Daily SMA200: 130.27
Levels:
Daily High: 130.15
Daily Low: 129.39
Weekly High: 129.34
Weekly Low: 127.24
Monthly High: 132.49
Monthly Low: 126.63
Daily Fibonacci 38.2%: 129.68
Daily Fibonacci 61.8%: 129.86
Daily Pivot Point S1: 129.21
Daily Pivot Point S2: 128.92
Daily Pivot Point S3: 128.46
Daily Pivot Point R1: 129.97
Daily Pivot Point R2: 130.43
Daily Pivot Point R3: 130.72
