EUR/USD daily chart
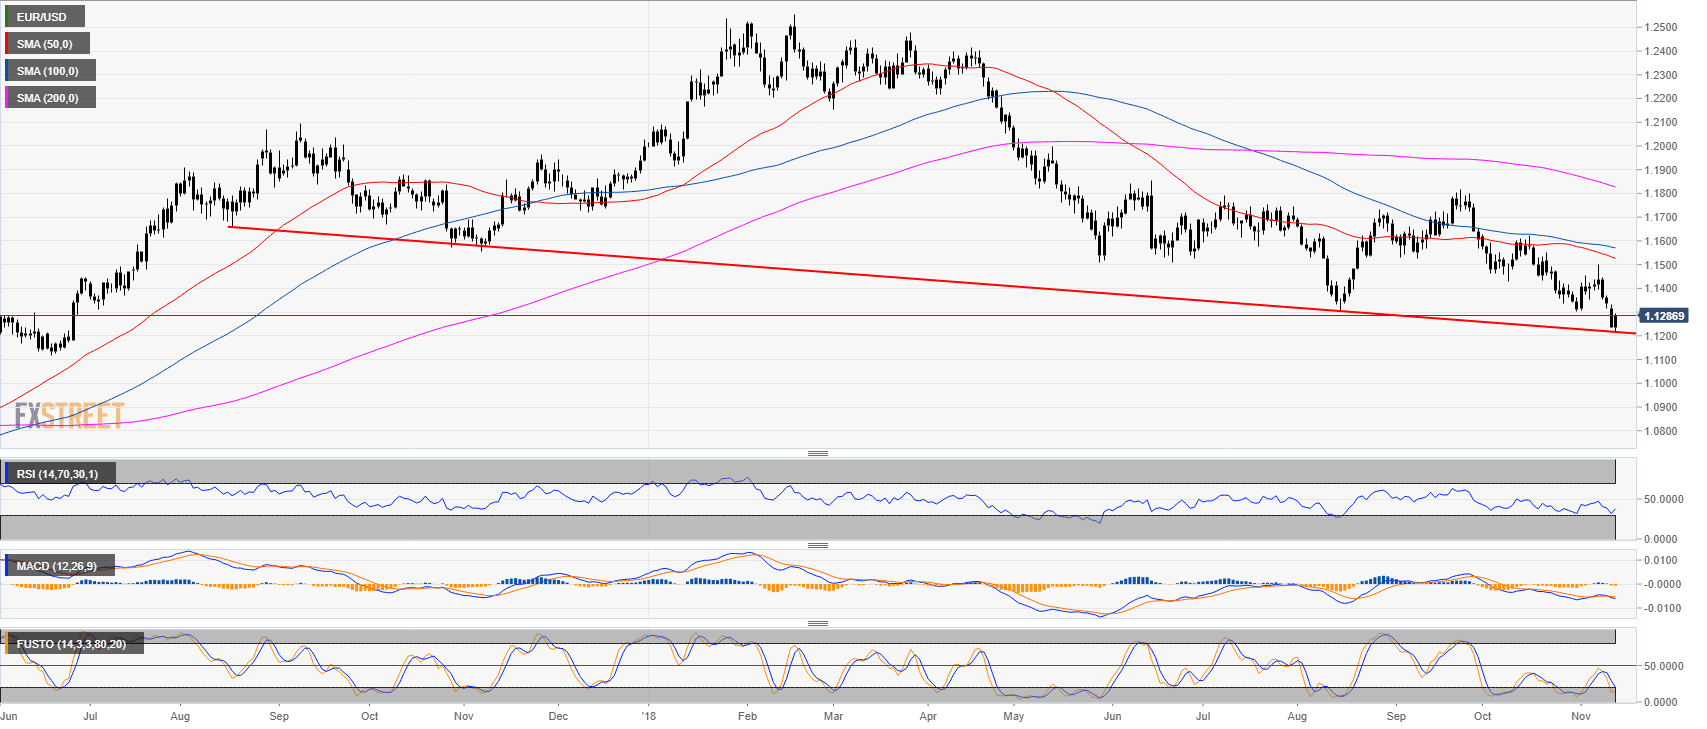
- EUR/USD found support at the bullish trendline from August 2017.
EUR/USD 4-hour chart
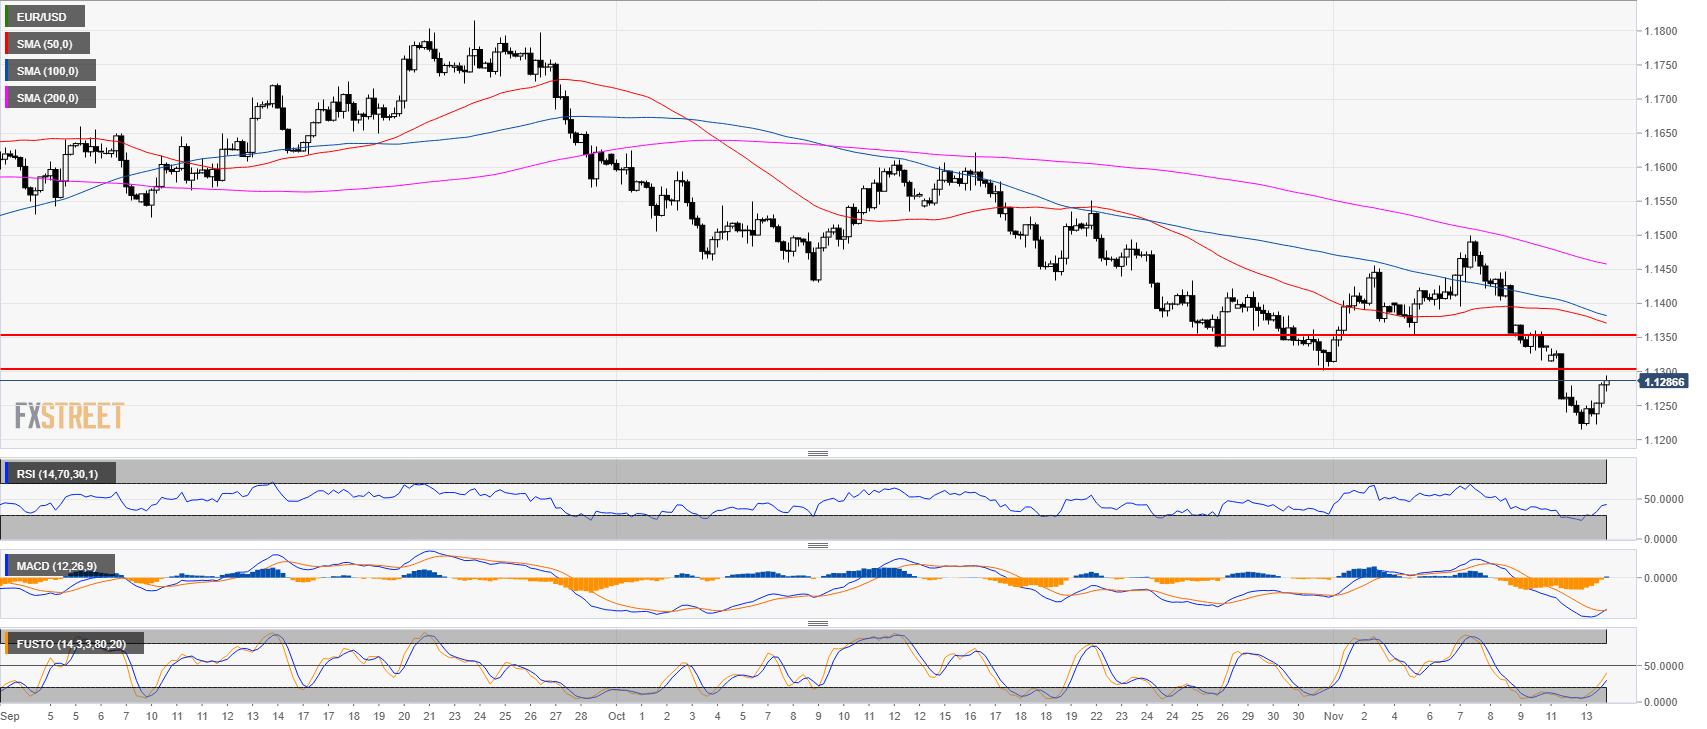
- Euro bulls are very close to reaching the 1.1300 figure.
- The RSI is still in negative territories below 50, the MACD is crossing over from below and the Stochastic is rising from the oversold area.
- If 1.1300 is broken then a potential rise to 1.3153 November 5 low can be on the cards.
EUR/USD 30-minute chart
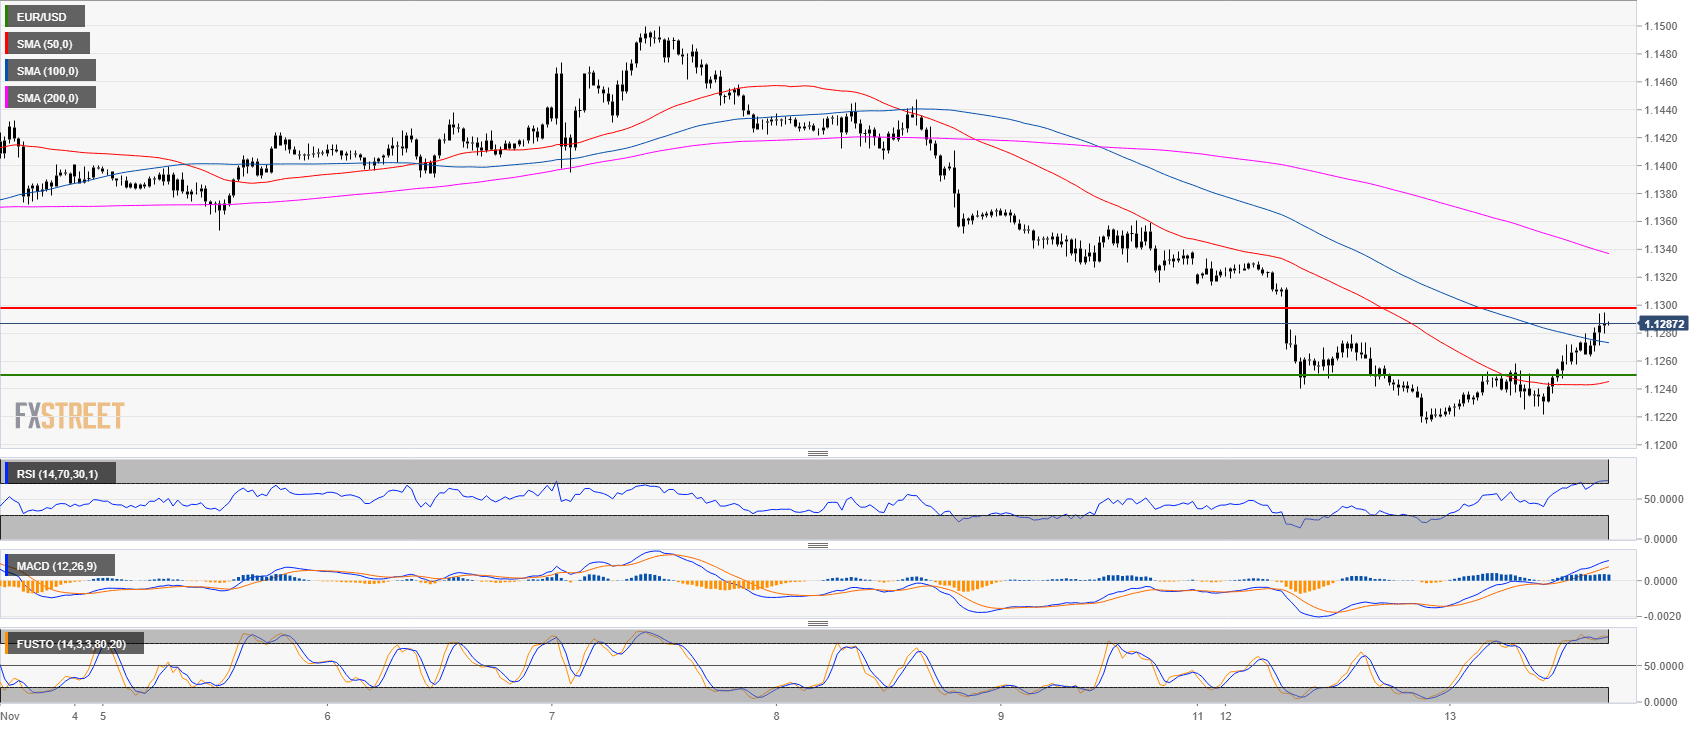
- The 1.1300 level will most likely offer strong resistance.
- Bears see 1.1300 as an opportunity to short.
- A pullback to 1.1250 can be an opportunity for bulls to join the potential bull trend.
Additional key levels at a glance:
EUR/USD
Overview:
Last Price: 1.1287
Daily change: 53 pips
Daily change: 0.472%
Daily Open: 1.1234
Trends:
Daily SMA20: 1.1408
Daily SMA50: 1.1532
Daily SMA100: 1.1574
Daily SMA200: 1.1835
Levels:
Daily High: 1.1334
Daily Low: 1.1234
Weekly High: 1.15
Weekly Low: 1.1316
Monthly High: 1.1625
Monthly Low: 1.1302
Daily Fibonacci 38.2%: 1.1272
Daily Fibonacci 61.8%: 1.1295
Daily Pivot Point S1: 1.12
Daily Pivot Point S2: 1.1167
Daily Pivot Point S3: 1.11
Daily Pivot Point R1: 1.13
Daily Pivot Point R2: 1.1367
Daily Pivot Point R3: 1.14
