USD/JPY daily chart
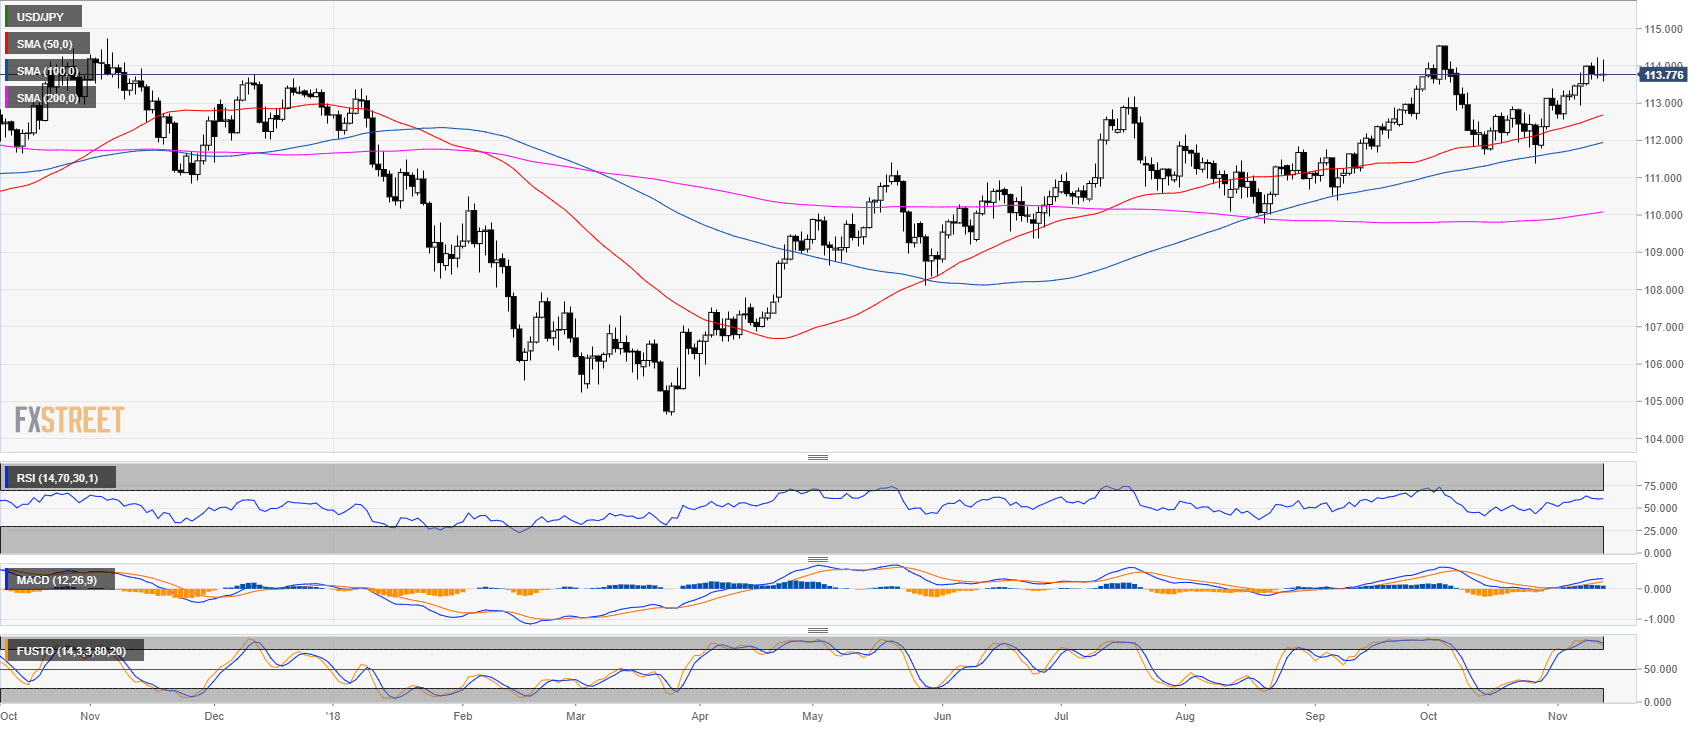
- USD/JPY is consolidating near the 114.00 figure for the fourth day in a row.
- The Stochastic indicator is in the overbought zone.
USD/JPY 4-hour chart
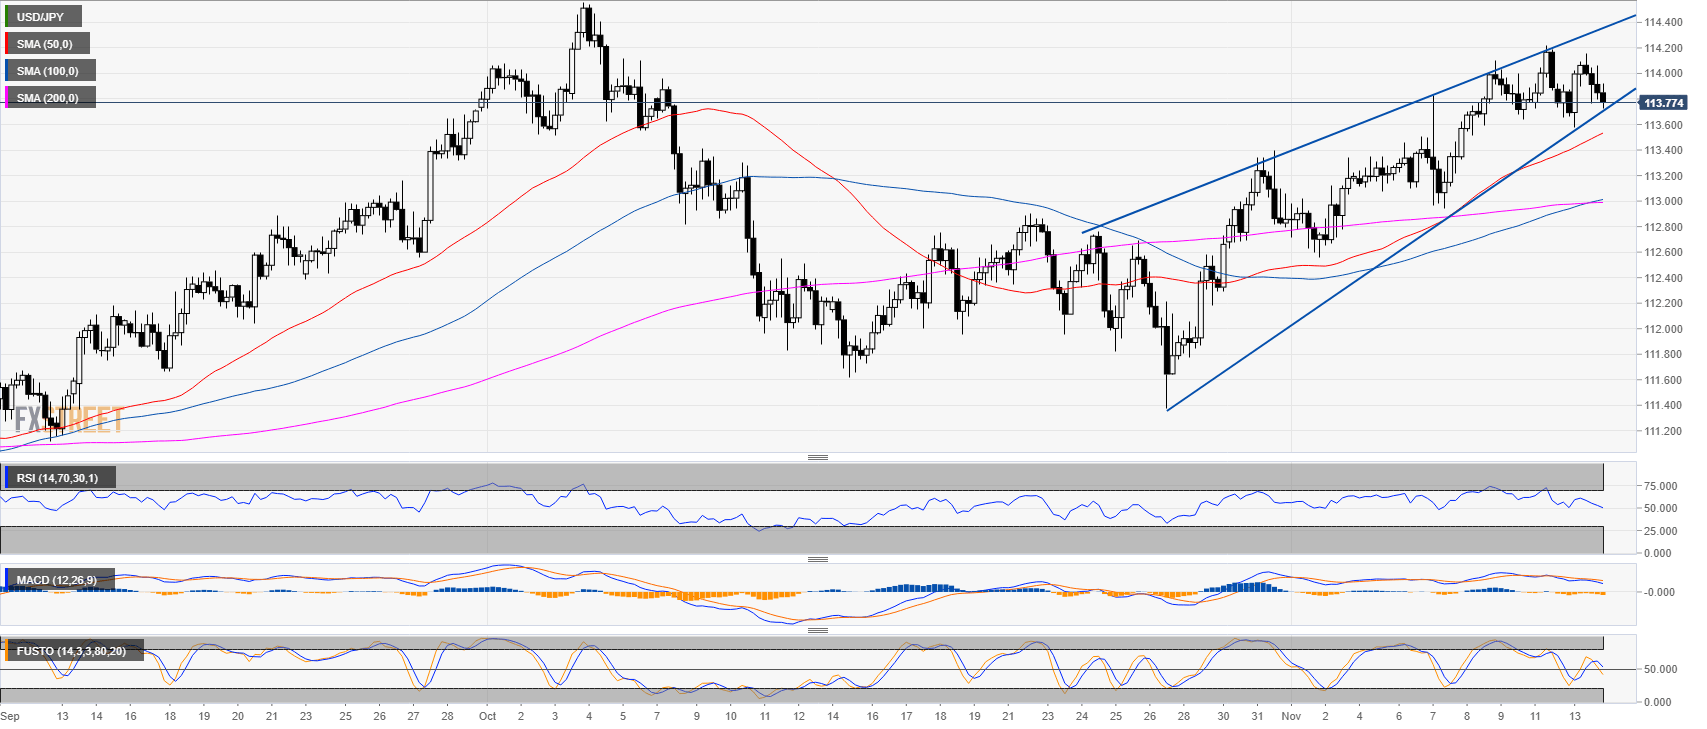
- USD/JPY is trading in a bull trend above the 200-period simple moving average (SMA).
- USD/JPY has formed a potentially bearish wedge.
- Technical indicators are decelerating.
USD/JPY 30-minute chart
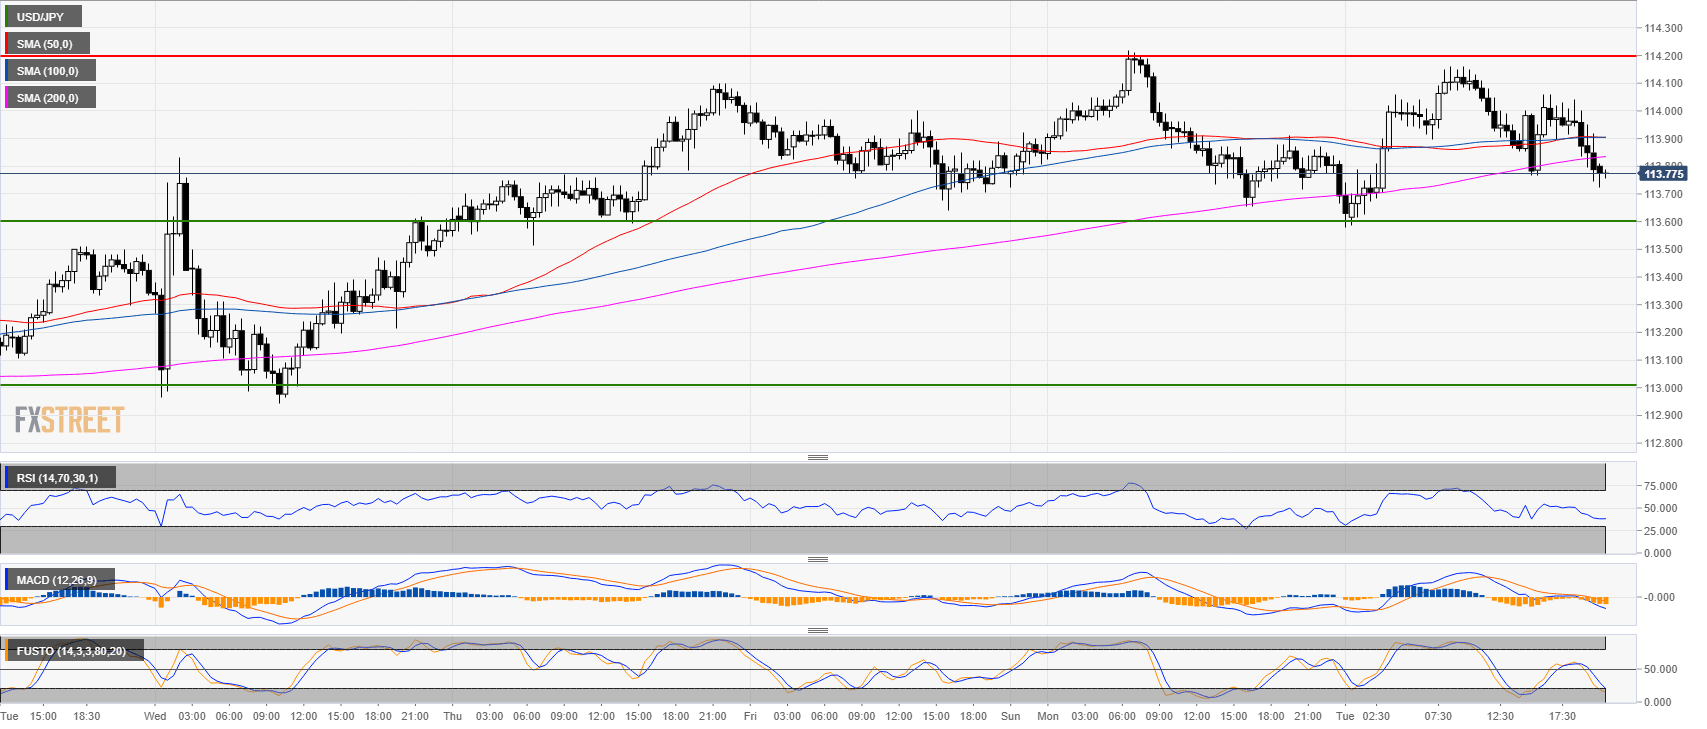
- Bulls need a break above 114.20.
- If bears break below 113.60 support it can open the door to 113.00 figure.
- Bears have a slight advantage.
Additional key levels at a glance:
USD/JPY
Overview:
Last Price: 113.77
Daily change: 1.0 pips
Daily change: 0.00879%
Daily Open: 113.76
Trends:
Daily SMA20: 112.88
Daily SMA50: 112.64
Daily SMA100: 111.91
Daily SMA200: 110.06
Levels:
Daily High: 114.22
Daily Low: 113.66
Weekly High: 114.1
Weekly Low: 112.94
Monthly High: 114.56
Monthly Low: 111.38
Daily Fibonacci 38.2%: 113.87
Daily Fibonacci 61.8%: 114
Daily Pivot Point S1: 113.54
Daily Pivot Point S2: 113.31
Daily Pivot Point S3: 112.97
Daily Pivot Point R1: 114.1
Daily Pivot Point R2: 114.44
Daily Pivot Point R3: 114.67
