GBP/USD daily chart
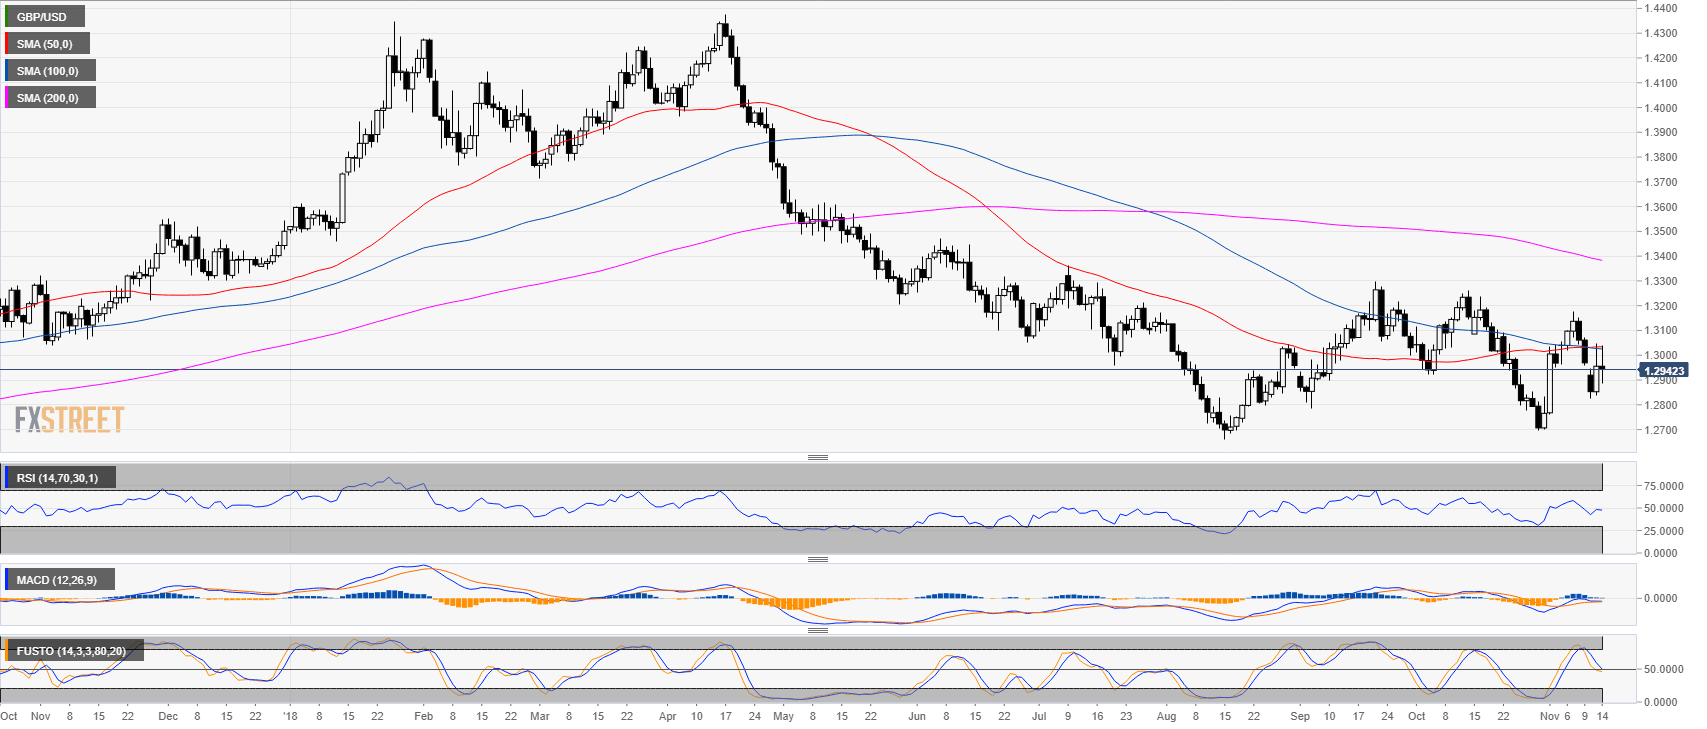
- GBP/USD bulls are facing a strong resistance comprised of 1.3000 figure and the 50 and 100-day simple moving average. The US Core CPI for October YoY came in at 2.1% vs. 2.2% forecast.
- The 50 SMA is crossing above the 100 SMA, which is called a golden cross and potentially bullish in the coming sessions.
GBP/USD 4-hour chart
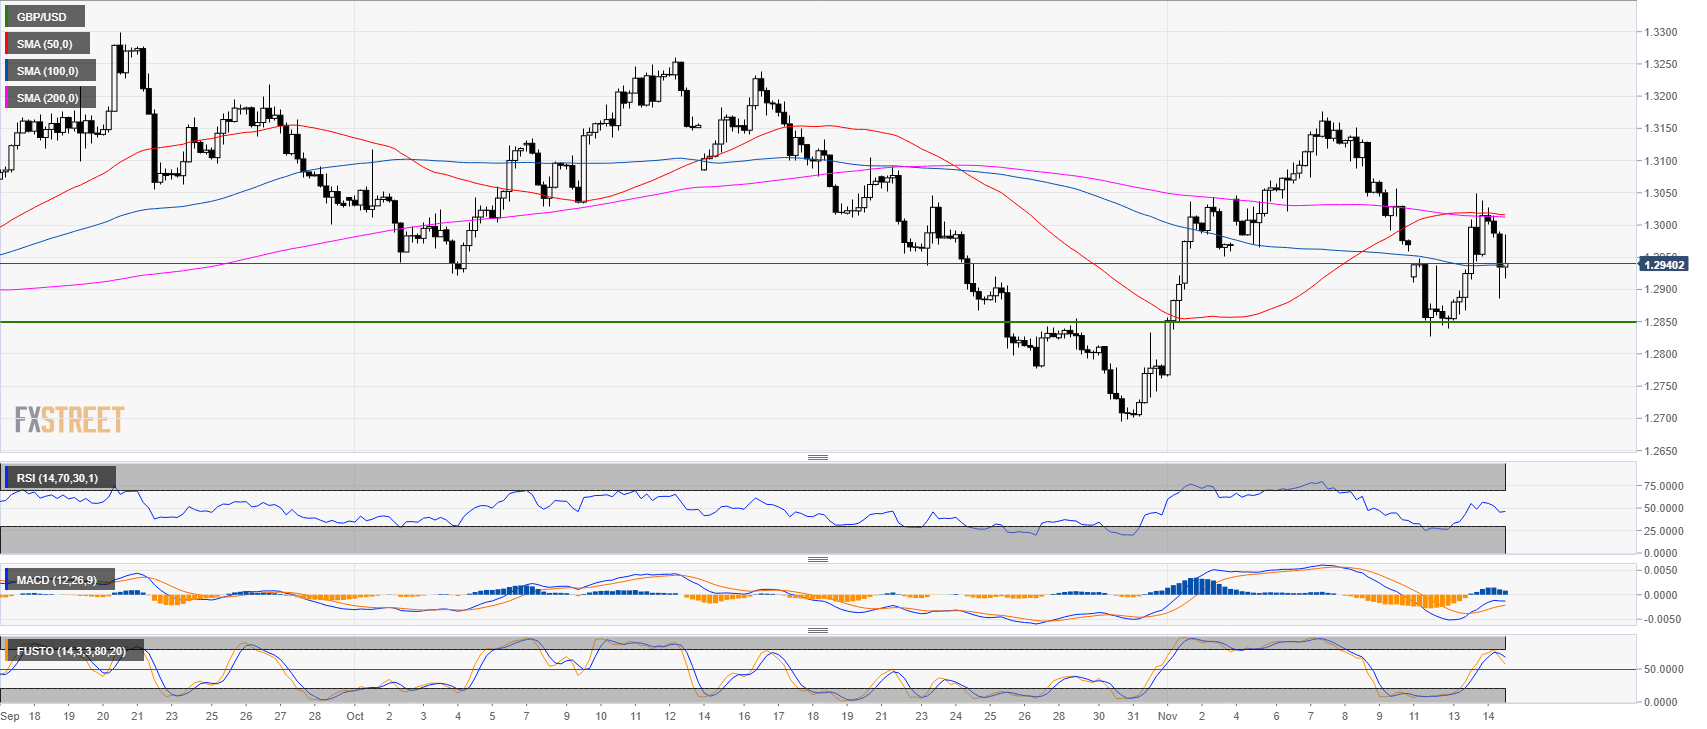
- GBP/USD is currently supported above the 50 SMA.
- As technical indicators are decelerating the market might have a fast drop to the 1.2850 level any time.
GBP/USD 30-minute chart
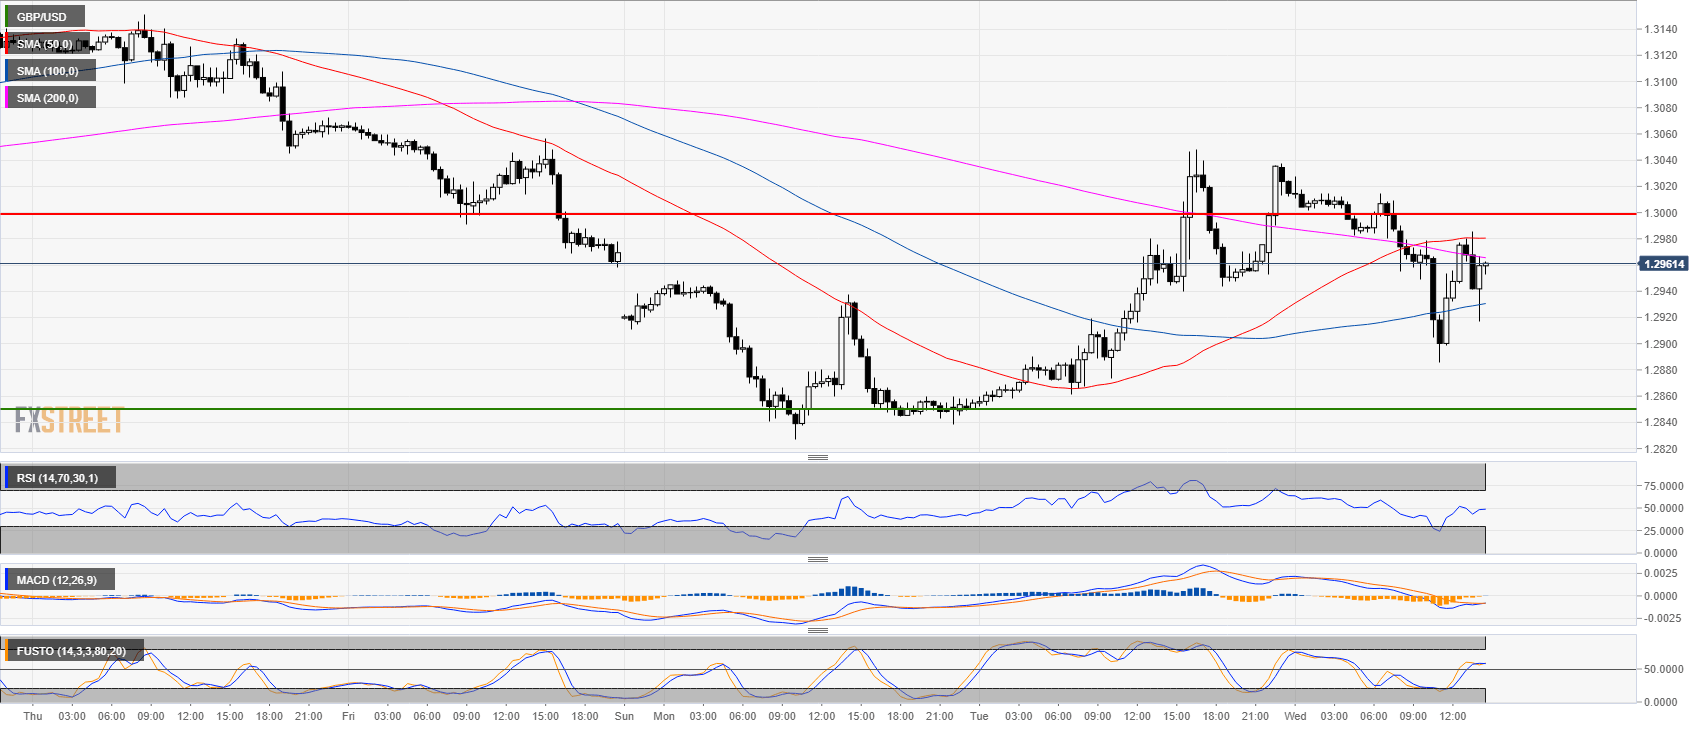
- GBP/USD is trading inside yesterday’s range trapped between the 50 and 100 SMA.
- Both bulls and bears have valid arguments, however, the 50 SMA crossed above the 200 SMA suggesting bullish momentum.
- Bulls need a beak above 1.3000 on a daily closing basis while bears need a break below the 1.2850 level.
Additional key levels at a glance:
GBP/USD
Overview:
Last Price: 1.296
Daily change: 4.0 pips
Daily change: 0.0309%
Daily Open: 1.2956
Trends:
Daily SMA20: 1.2951
Daily SMA50: 1.3034
Daily SMA100: 1.3027
Daily SMA200: 1.339
Levels:
Daily High: 1.3048
Daily Low: 1.2839
Weekly High: 1.3176
Weekly Low: 1.2958
Monthly High: 1.326
Monthly Low: 1.2696
Daily Fibonacci 38.2%: 1.2968
Daily Fibonacci 61.8%: 1.2919
Daily Pivot Point S1: 1.2847
Daily Pivot Point S2: 1.2738
Daily Pivot Point S3: 1.2637
Daily Pivot Point R1: 1.3057
Daily Pivot Point R2: 1.3157
Daily Pivot Point R3: 1.3266
