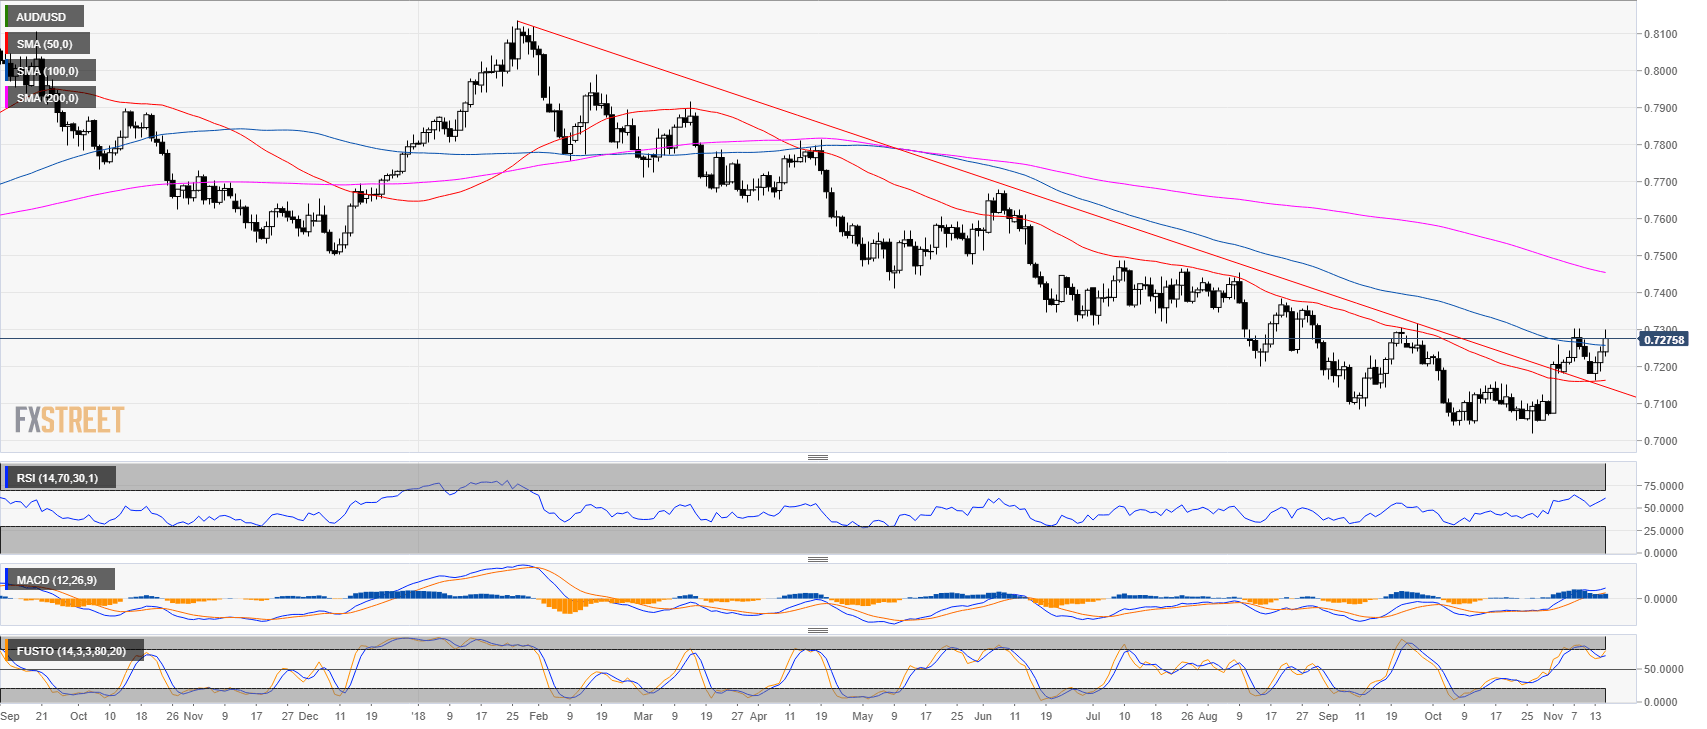
- AUD/USD is trading above its 50-day simple moving average and the 2018 bear trendline.
AUD/USD daily chart
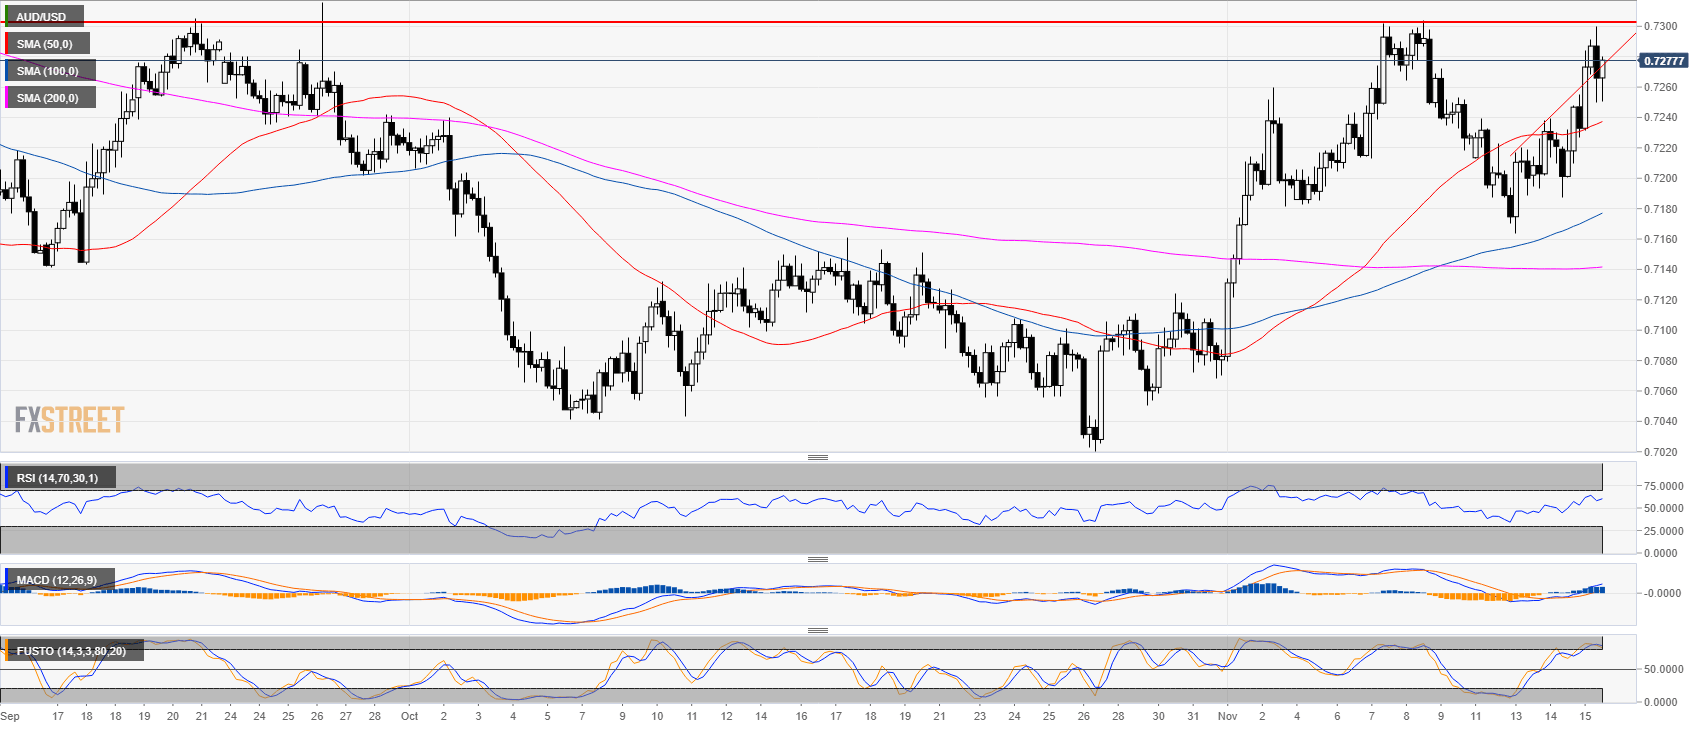
- AUD/USD reached the 0.7300 figure and created a double top with the previous November high.
- 0.7300 become the level to beat if bulls want to continue the uptrend.
AUD/USD 4-hour chart
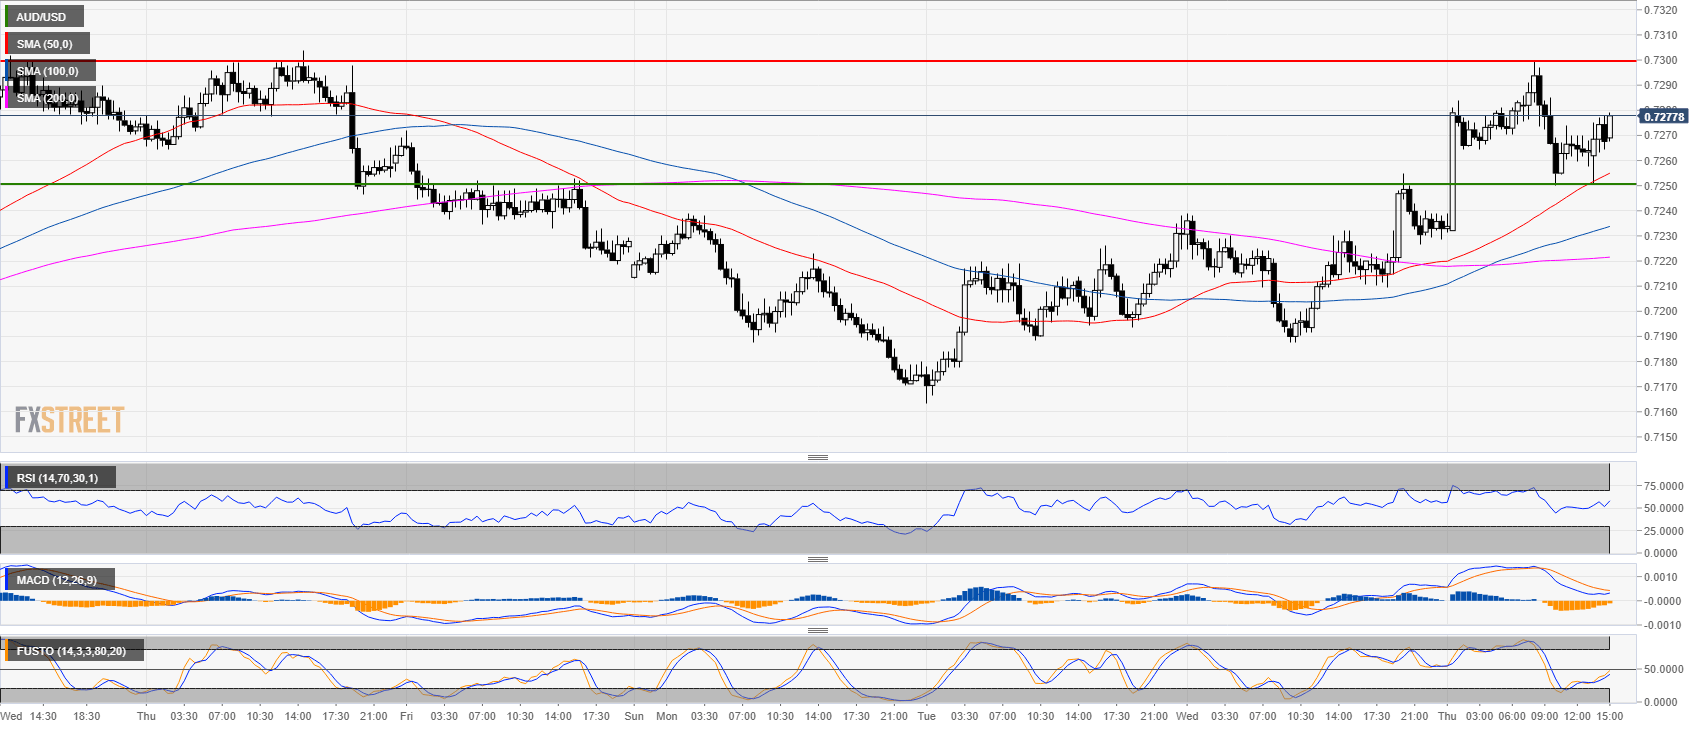
- Failure to break above 0.7300 can lead to a pullback down 0.7250
AUD/USD 30-minute chart
Additional key levels at a glance:
AUD/USD
Overview:
Last Price: 0.7275
Daily change: 35 pips
Daily change: 0.483%
Daily Open: 0.724
Trends:
Daily SMA20: 0.7154
Daily SMA50: 0.7162
Daily SMA100: 0.7258
Daily SMA200: 0.7459
Levels:
Daily High: 0.7255
Daily Low: 0.7188
Weekly High: 0.7304
Weekly Low: 0.7183
Monthly High: 0.724
Monthly Low: 0.702
Daily Fibonacci 38.2%: 0.7229
Daily Fibonacci 61.8%: 0.7213
Daily Pivot Point S1: 0.72
Daily Pivot Point S2: 0.716
Daily Pivot Point S3: 0.7132
Daily Pivot Point R1: 0.7267
Daily Pivot Point R2: 0.7295
Daily Pivot Point R3: 0.7335
