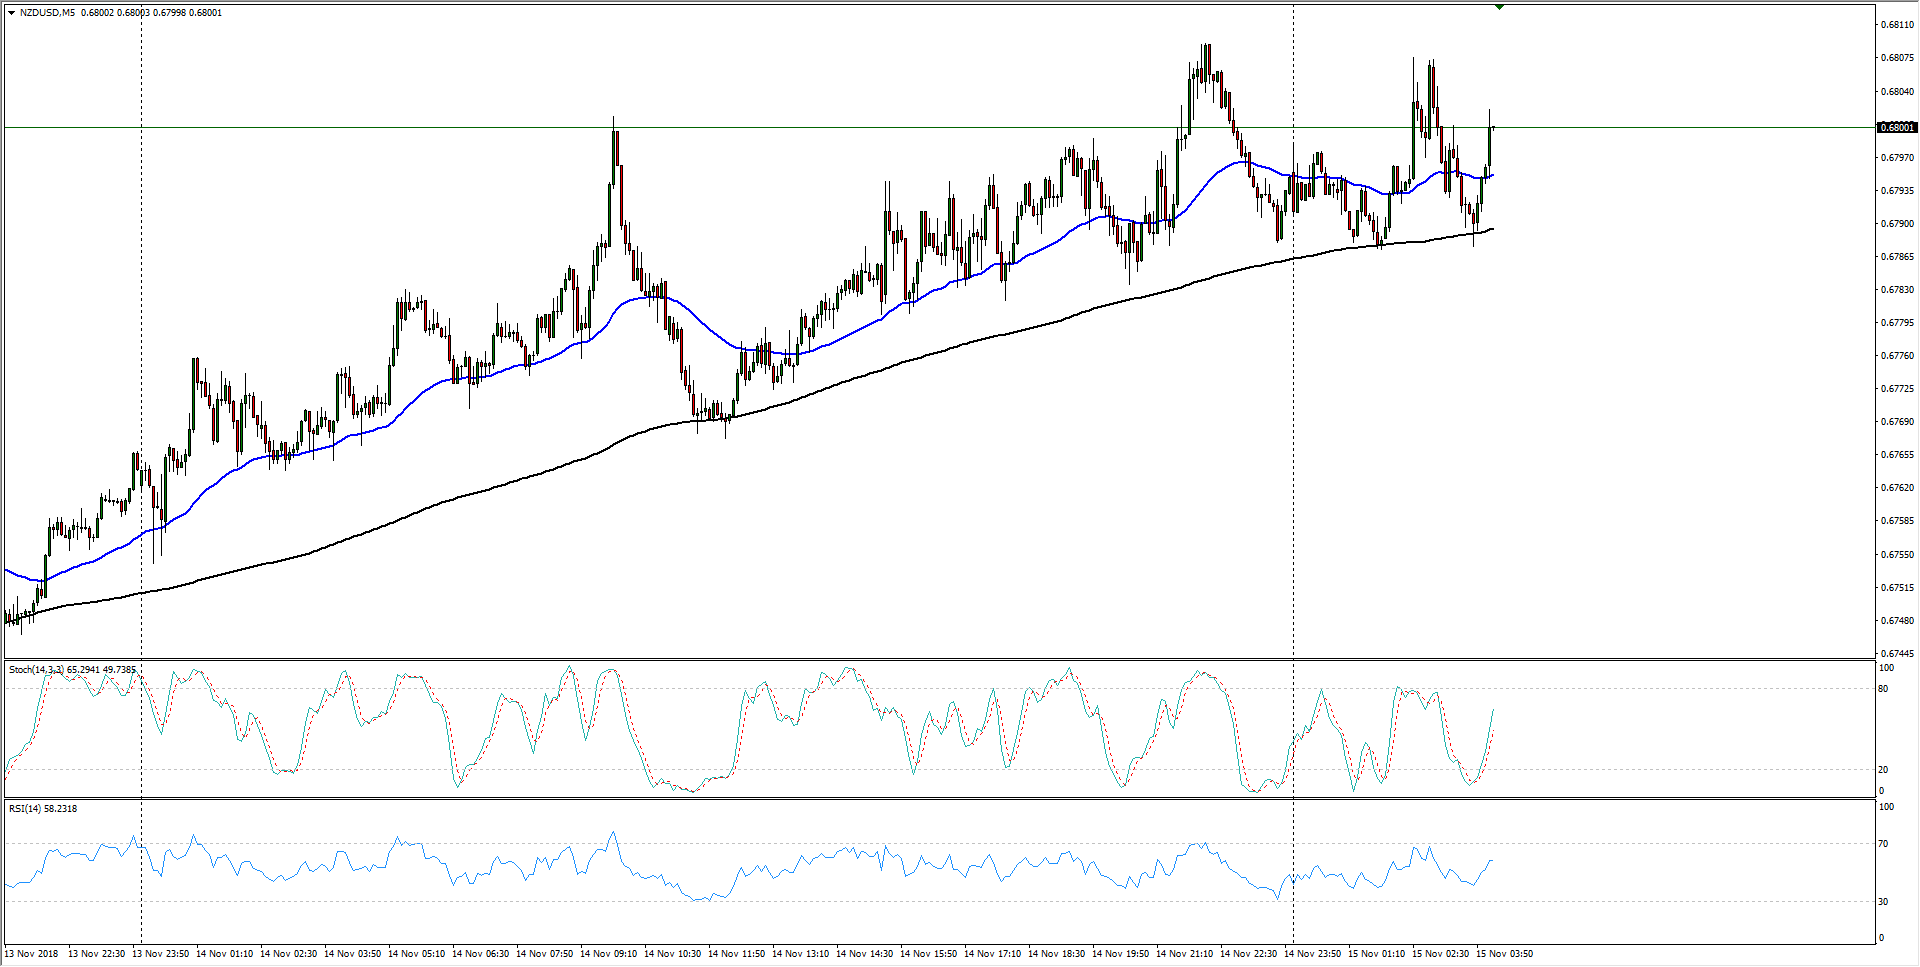
- Intraday action on the short-term charts sees bullish momentum draining out of the NZD/USD, with common support from the 2-period moving average at 0.6720.
NZD/USD chart, 5-Minute
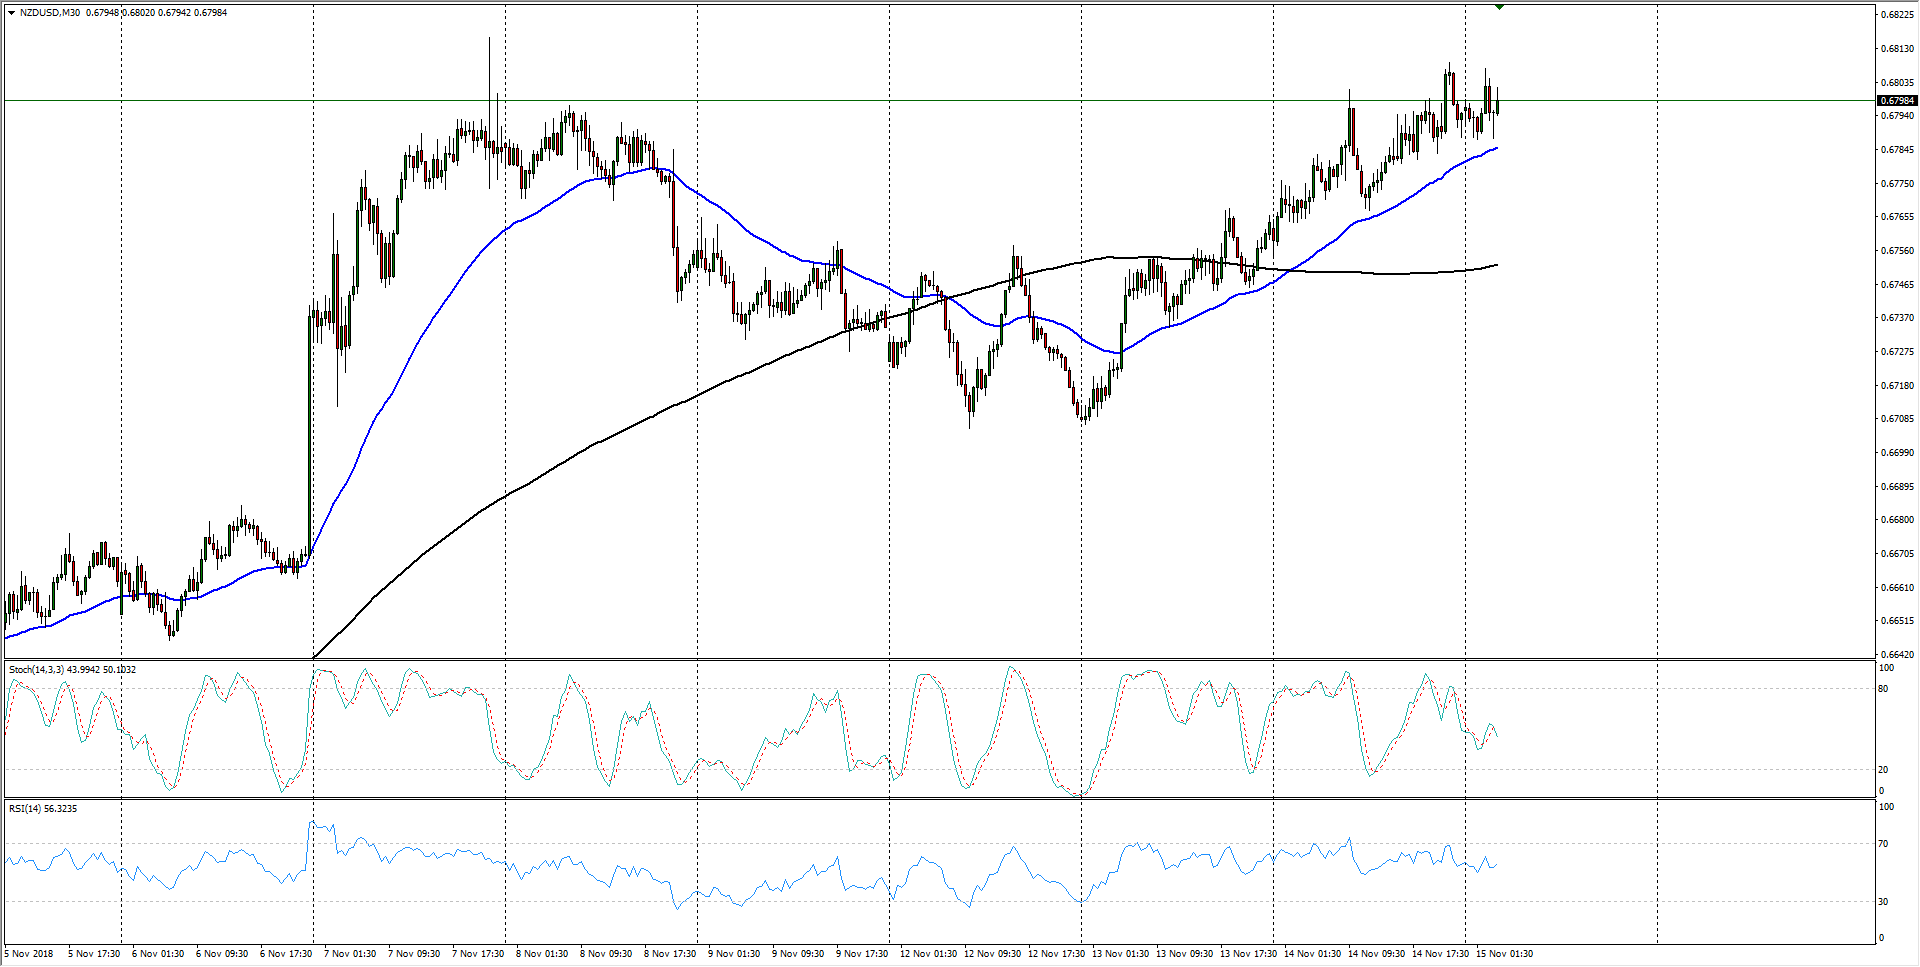
- With the NZD/USD testing into 0.6800, shortside pressure remains firm, and a failure by Kiwi bulls to haul the pair meaningfully over the major barrier will see the Kiwi collapsing back into recentner
NZD/USD chart, 30-Minute
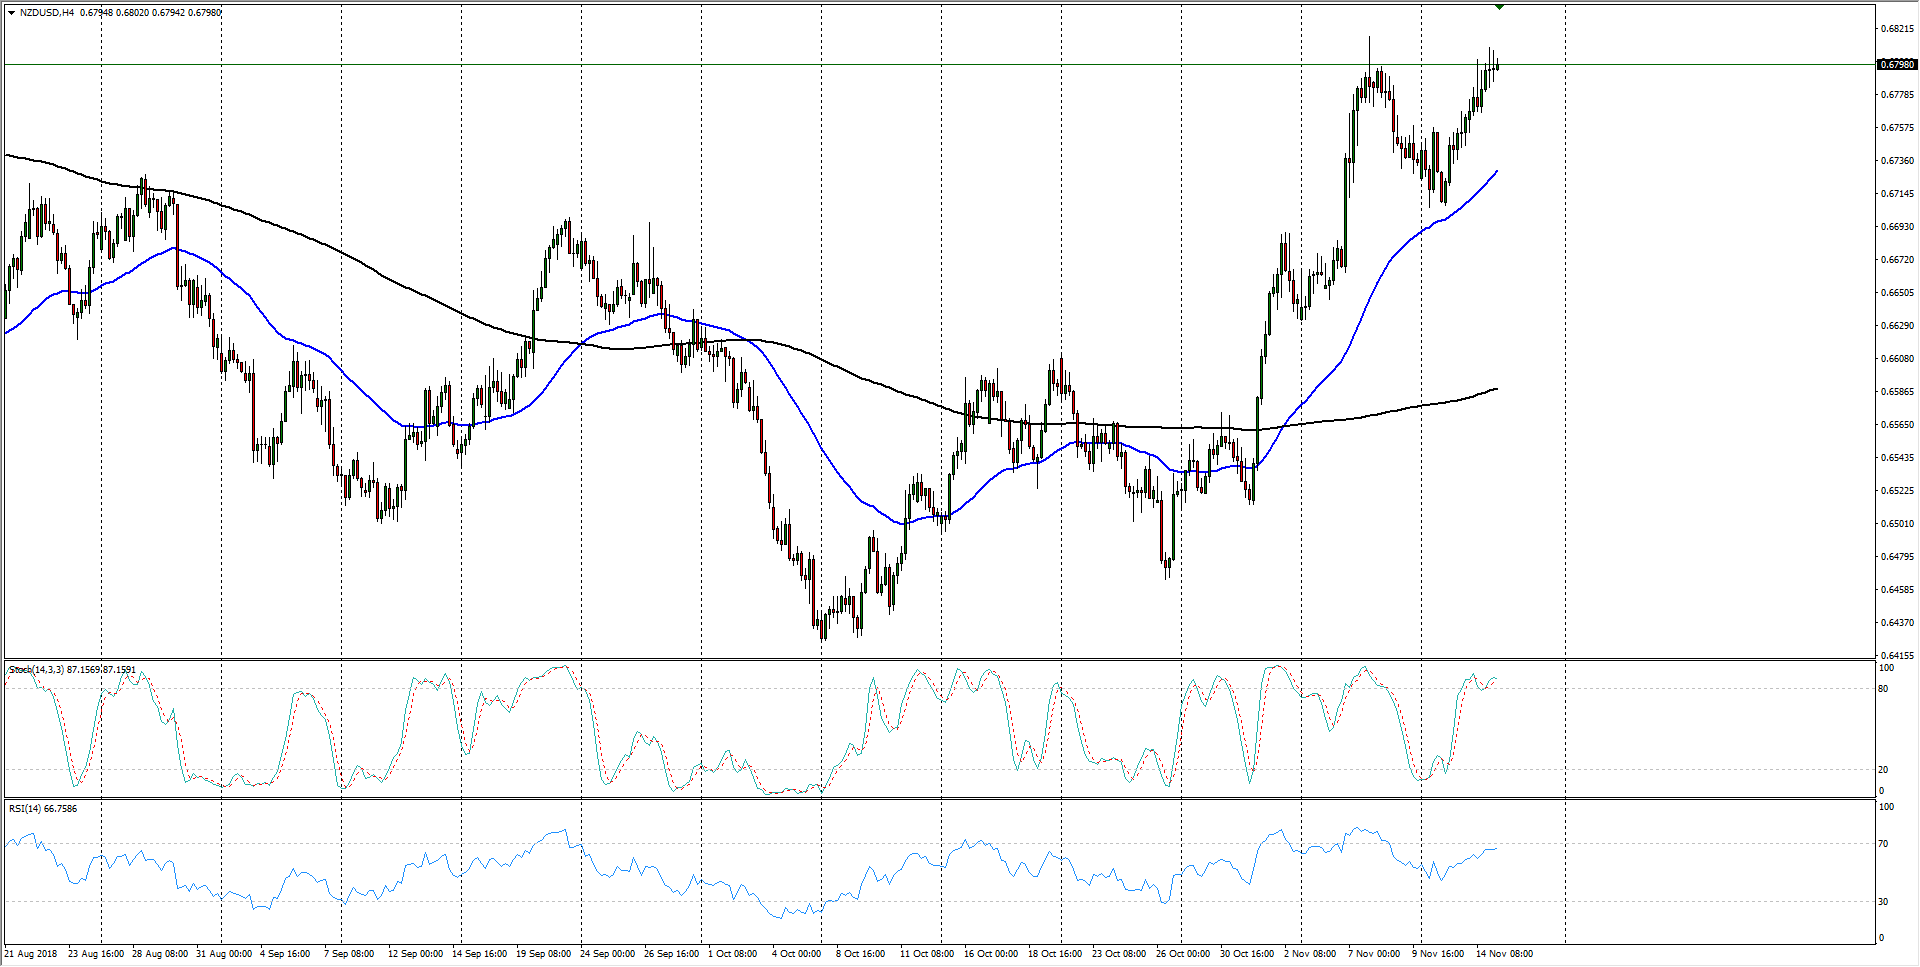
- The past three months have the Kiwi testing into a ceiling near 0.6820, getting support from the last swing low into the 0.6700 handle, while the 200-period moving average continues to firm up long-term support from 0.6580.
NZD/USD chart, 4-Hour
NZD/USD
Overview:
Last Price: 0.6795
Daily change: -2.0 pips
Daily change: -0.0294%
Daily Open: 0.6797
Trends:
Daily SMA20: 0.6629
Daily SMA50: 0.659
Daily SMA100: 0.6656
Daily SMA200: 0.6896
Levels:
Daily High: 0.681
Daily Low: 0.6756
Weekly High: 0.682
Weekly Low: 0.6632
Monthly High: 0.663
Monthly Low: 0.6424
Daily Fibonacci 38.2%: 0.679
Daily Fibonacci 61.8%: 0.6777
Daily Pivot Point S1: 0.6765
Daily Pivot Point S2: 0.6733
Daily Pivot Point S3: 0.671
Daily Pivot Point R1: 0.682
Daily Pivot Point R2: 0.6843
Daily Pivot Point R3: 0.6875
