- Intraday readings for the USD/JPY show the US Dollar stepping back against the Yen, and the past twenty-four hours have the USD/JPY knocking down into lower highs.
- USD/JPY short-term traders should be looking for a continuation of USD selling, at least until Thursday’s US Retail Sales reading due at 13:30 GMT, where Dollar bulls would be more likely to step back into the fold.
USD/JPY Chart, 5-Minute
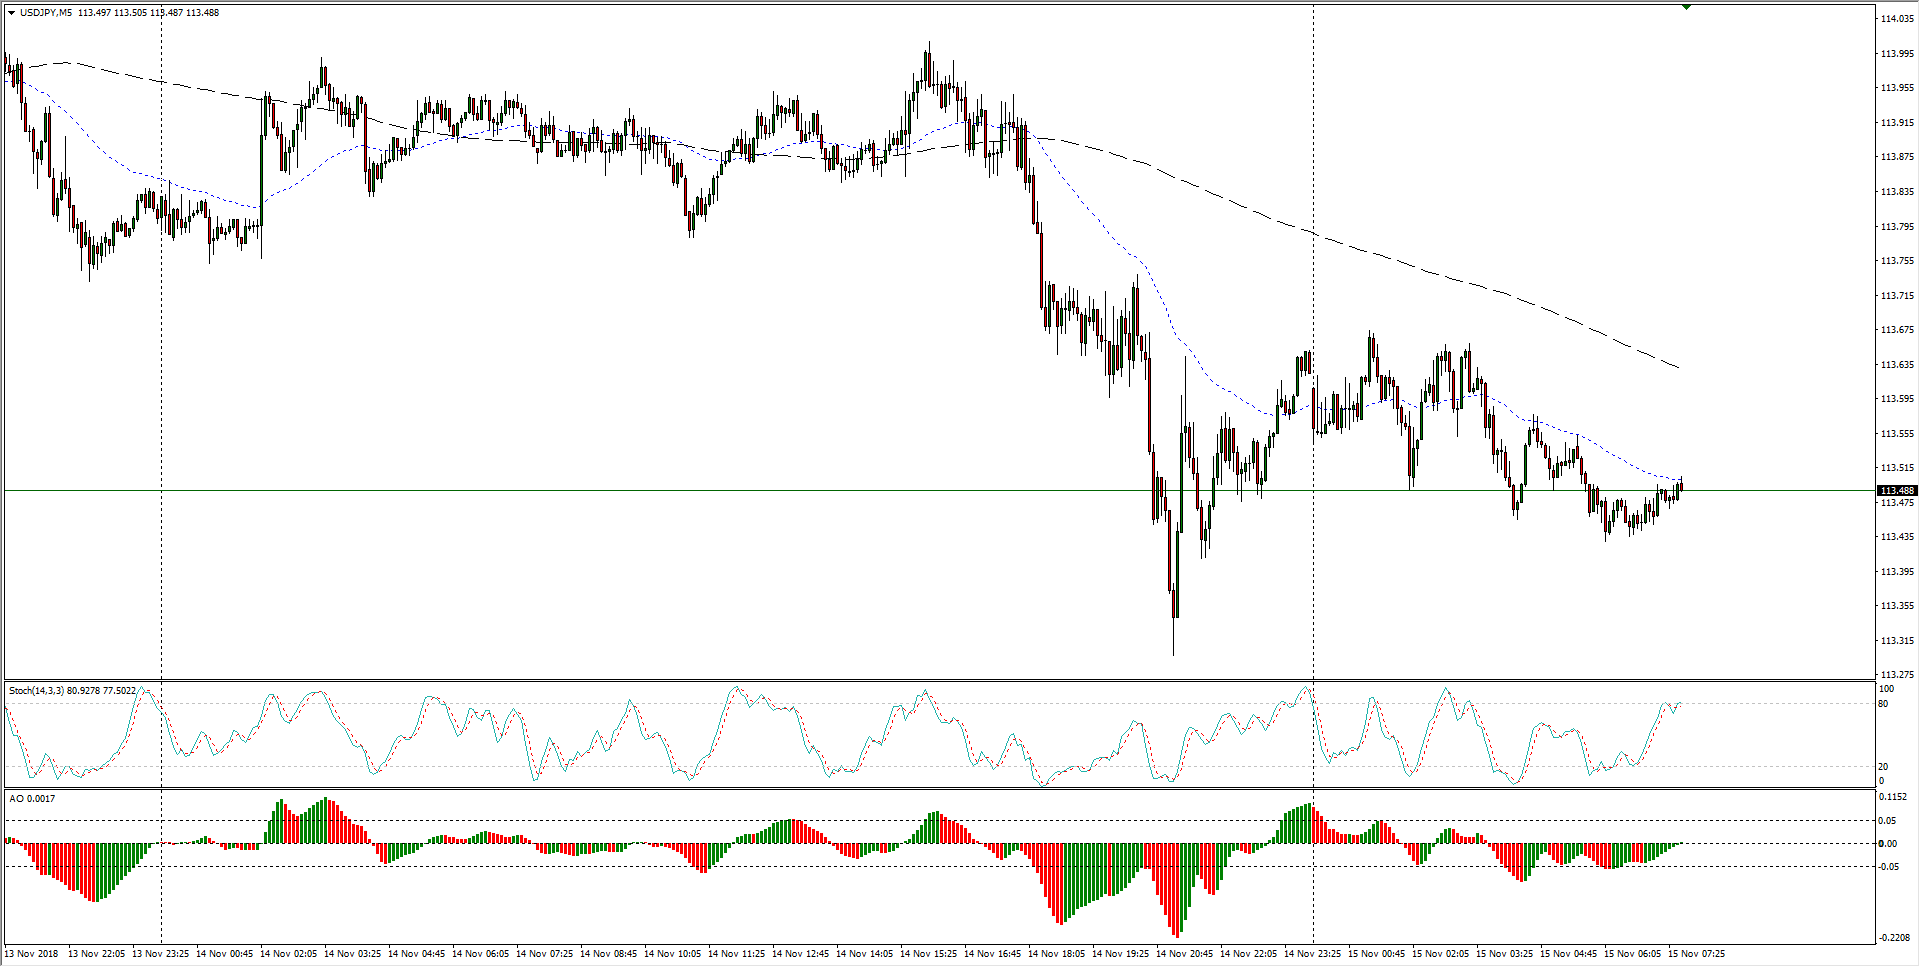
- The past week has seen the Dollar-Yen pairing test into a near-term upper bound above 144.00, and yesterday knock below recent consolidation has the USD/JPY primed for a continued fall assuming a bullish retest of 113.65 fails to generate a bullish return to the median.
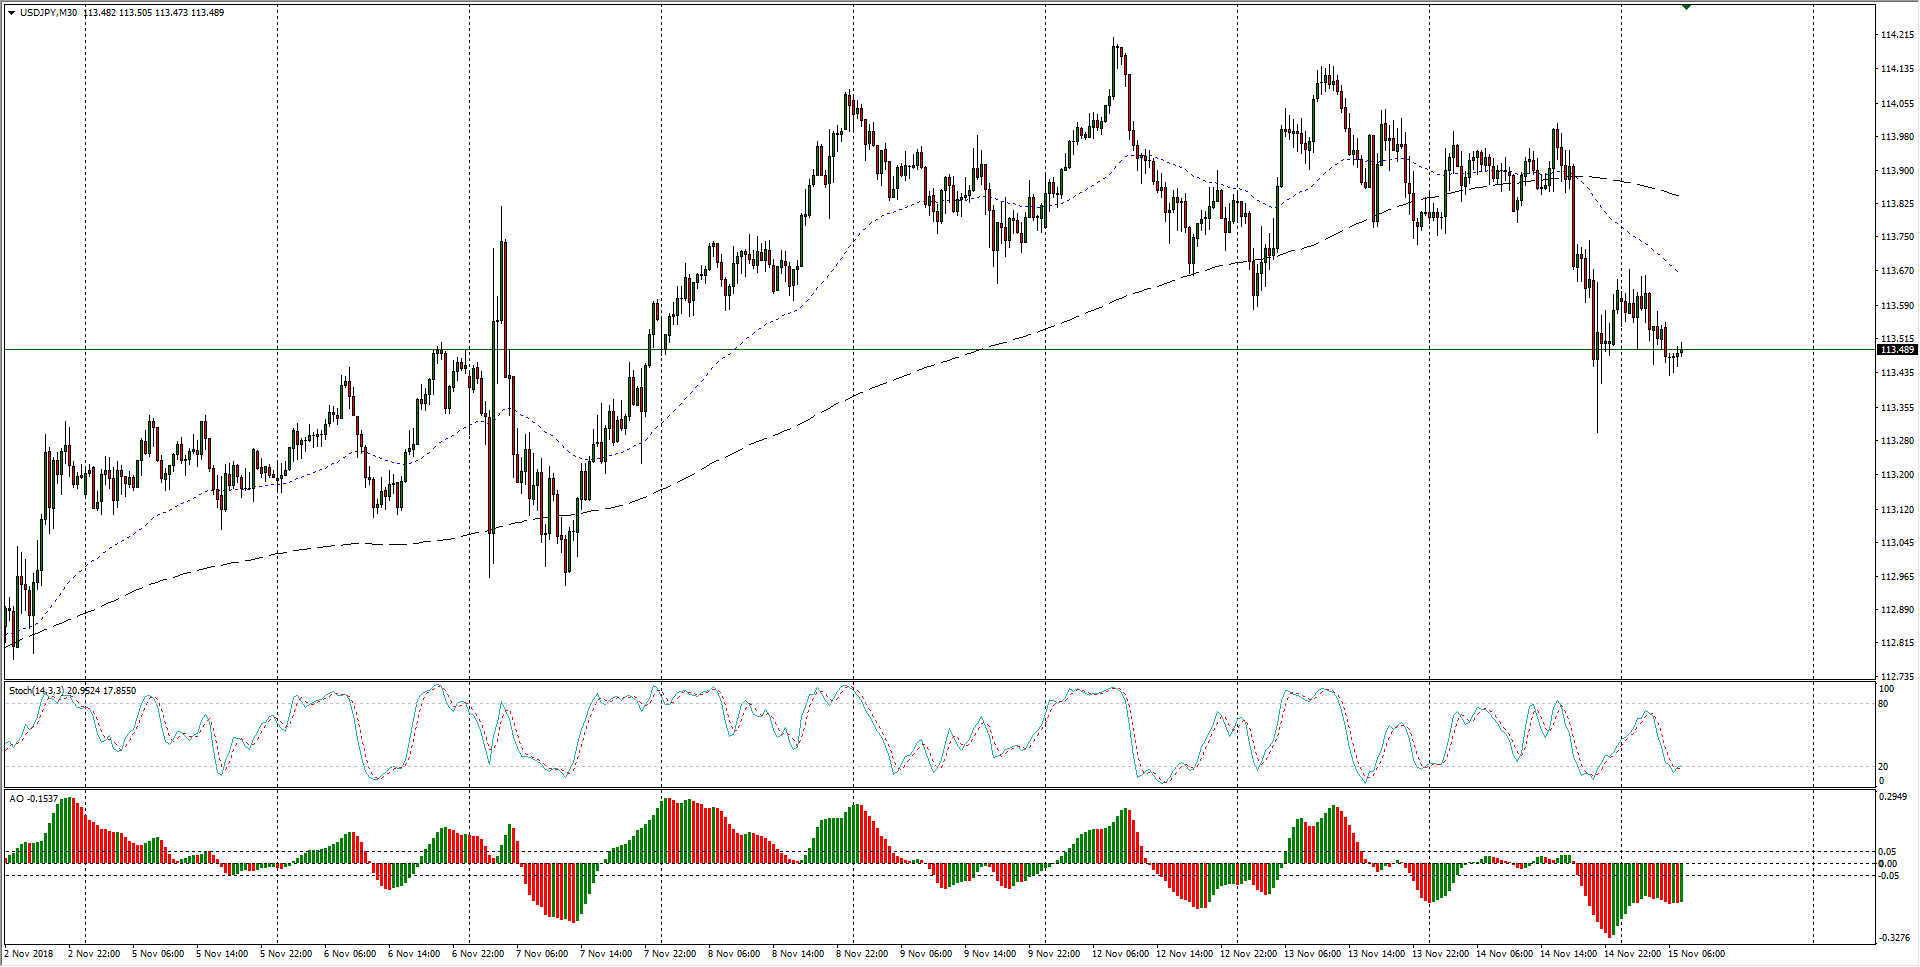
USD/JPY Chart, 30-Minute
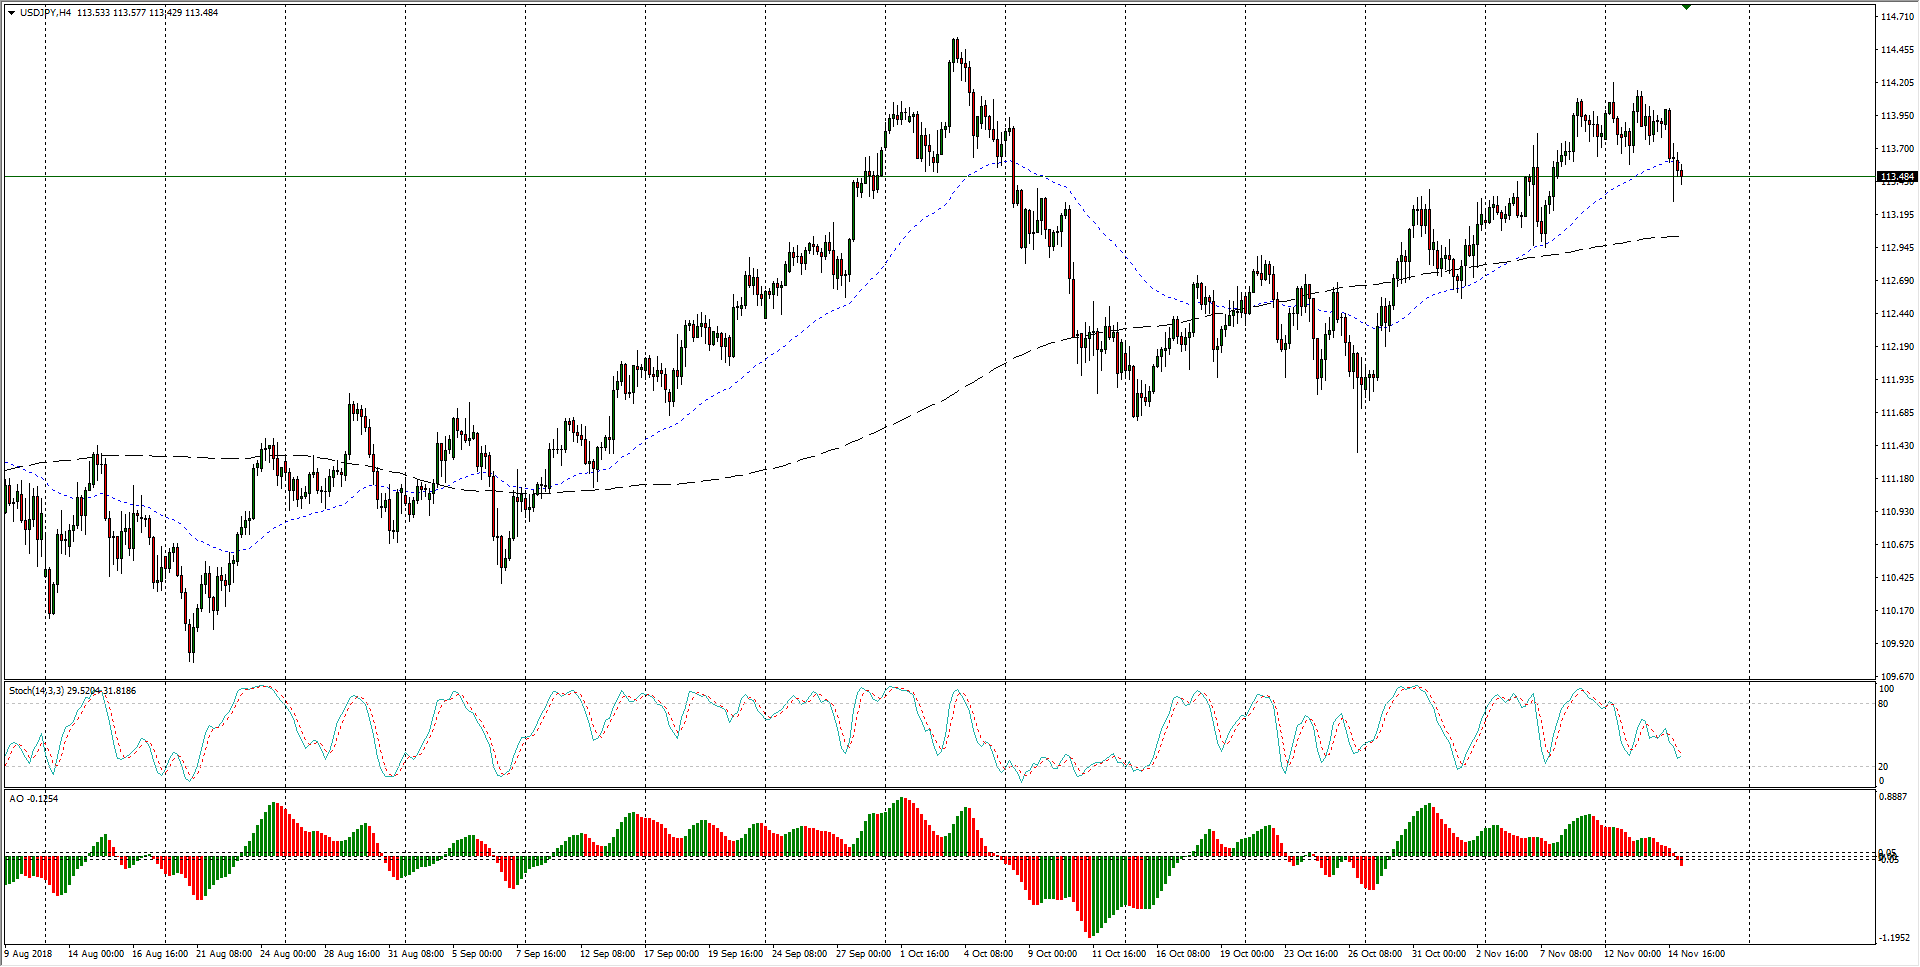
- The past two months see the USD/JPY still enjoying some bullish pressure from consecutive higher lows, but the last time the pair fell below a bullish 50-period moving average on H4 candles the pair was clear for a move to beyond the 200-period moving average; a similar scenario here will see the USD/JPY continue the current drop into 113.00, where support is likely to challenge the shortside.
USD/JPY Chart, 4-Hour
USD/JPY
Overview:
Last Price: 113.48
Daily change: -2.0 pips
Daily change: -0.0176%
Daily Open: 113.5
Trends:
Daily SMA20: 113
Daily SMA50: 112.72
Daily SMA100: 111.98
Daily SMA200: 110.1
Levels:
Daily High: 114.02
Daily Low: 113.3
Weekly High: 114.1
Weekly Low: 112.94
Monthly High: 114.56
Monthly Low: 111.38
Daily Fibonacci 38.2%: 113.57
Daily Fibonacci 61.8%: 113.74
Daily Pivot Point S1: 113.19
Daily Pivot Point S2: 112.88
Daily Pivot Point S3: 112.47
Daily Pivot Point R1: 113.92
Daily Pivot Point R2: 114.33
Daily Pivot Point R3: 114.64
