- The past twenty-four hours have seen the Aussie lift and then settle again against the Kiwi, leaving AUD/NZD more or less where it started the week as bidders struggle to return to the fold.
AUD/NZD Chart, 5-Minute
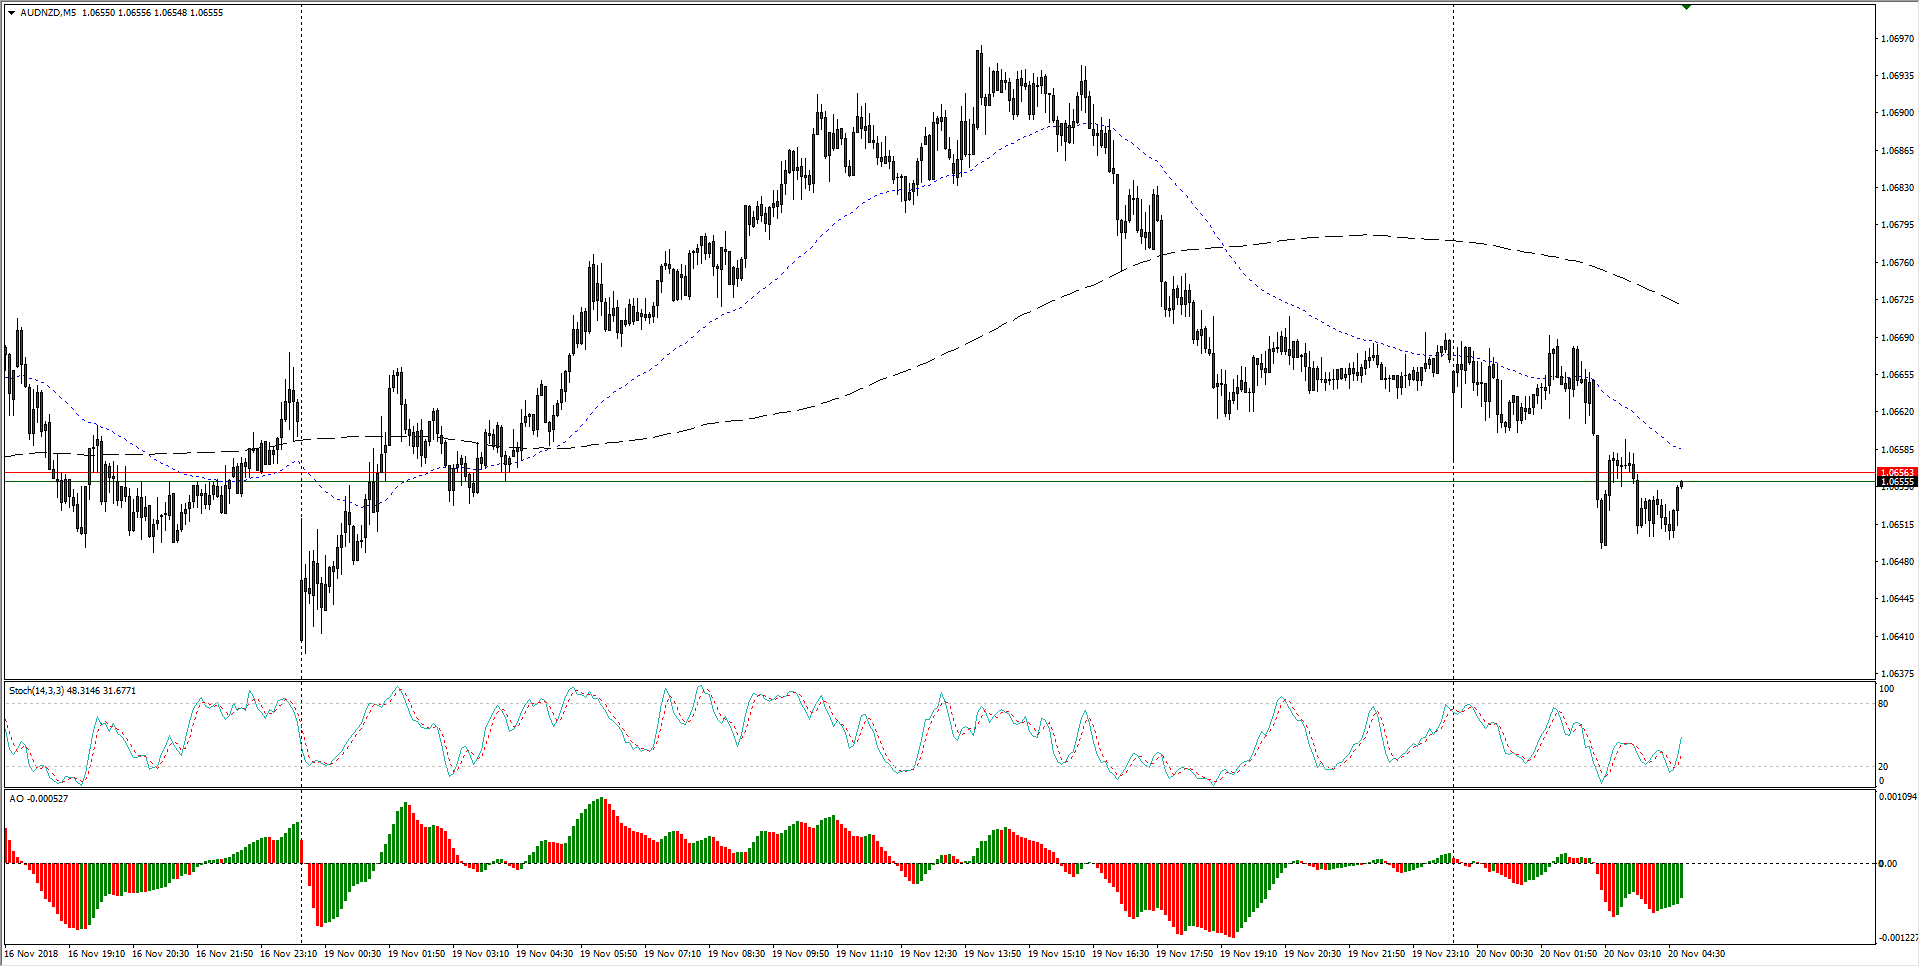
- Over the near-term, the Aussie is exposed its softer underside more often than not, keeping the AUD/NZD pinned to the low end of the 100-hour moving average currently sitting near 1.0660.
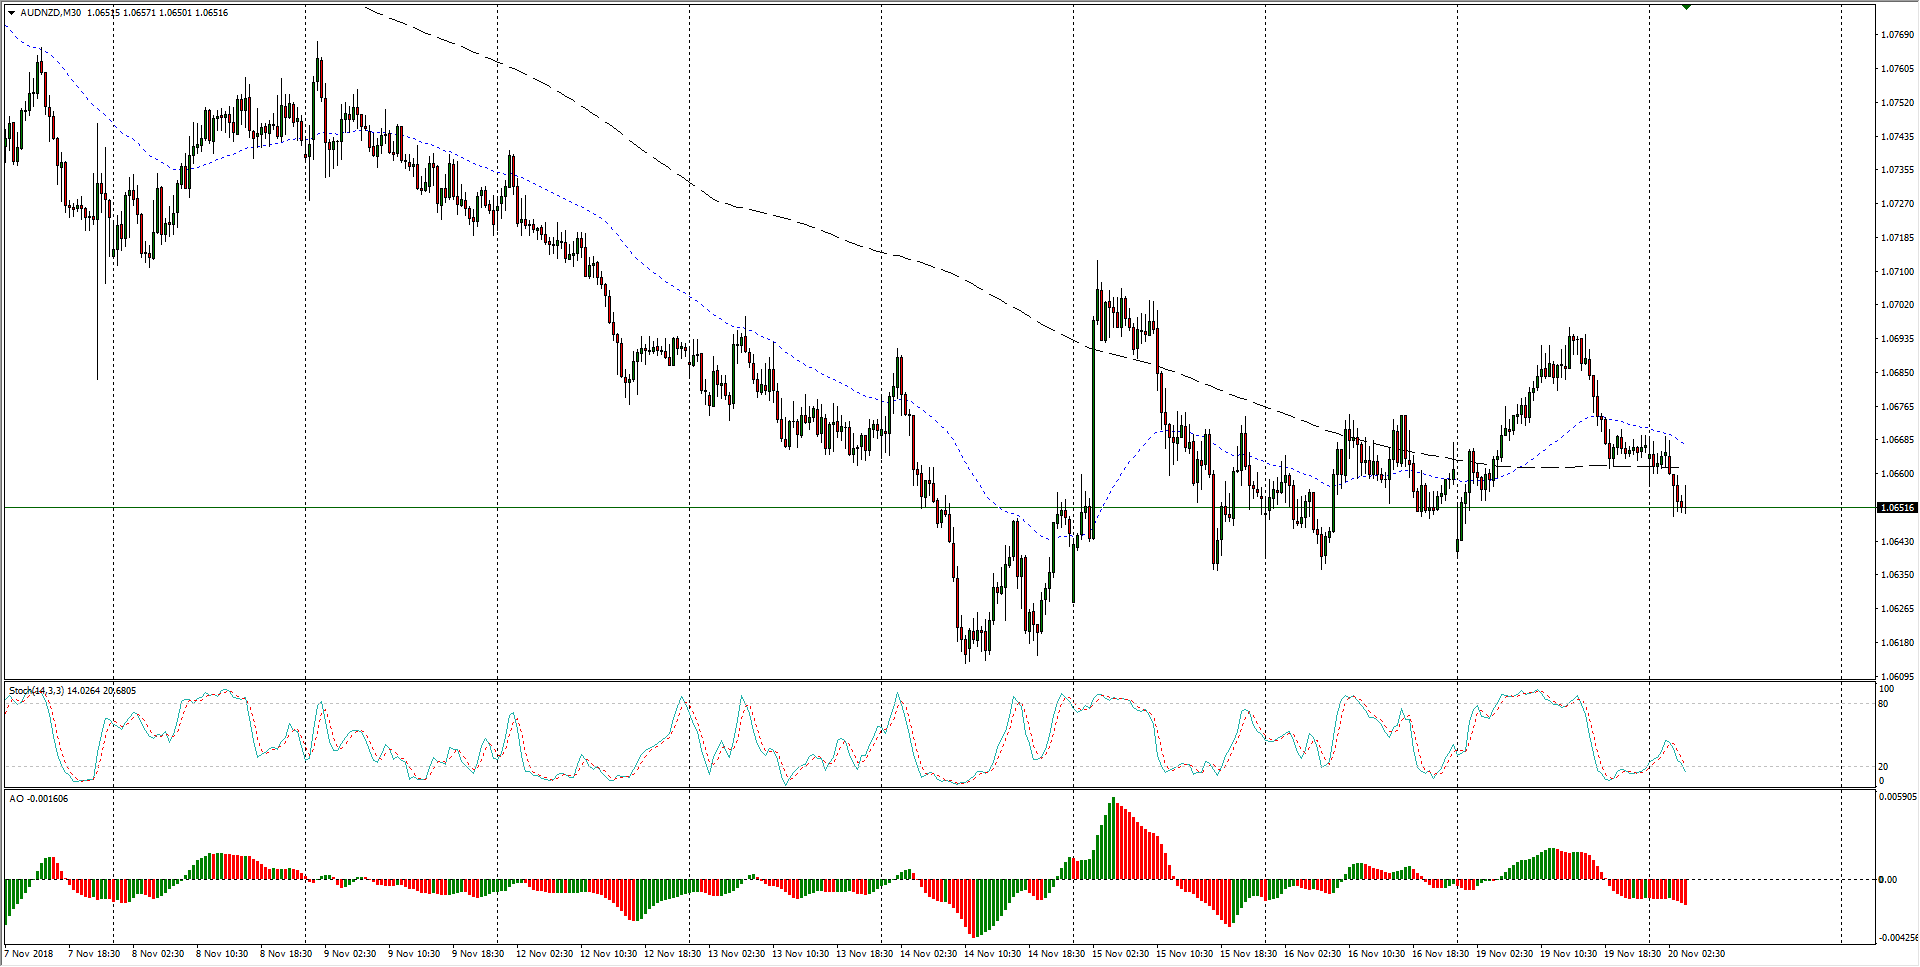
AUD/NZD Chart, 30-Minute
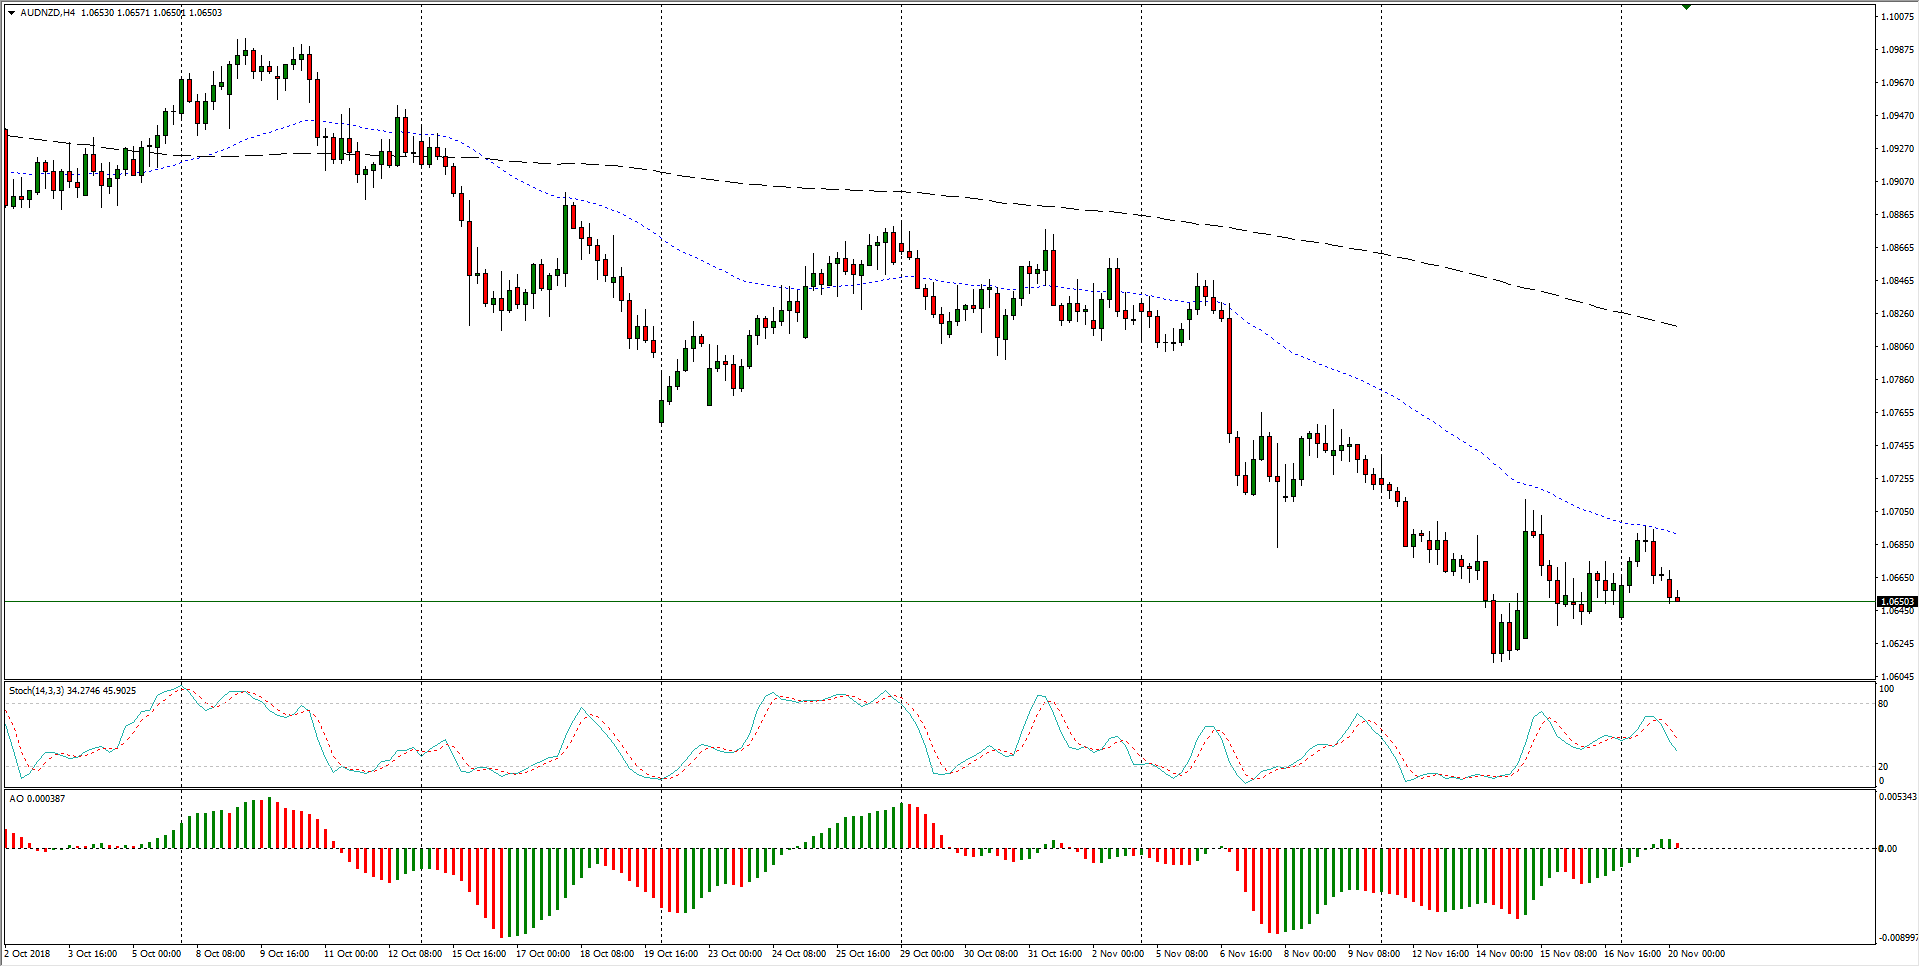
- Over the past two months, the Aussie-Kiwi has flagged into the downside as the AUD continues to suffer a confidence crisis at the hands of slumping Chinese trade figures, offset by New Zealand’s decidedly sunnier outlook, and the pair has a long way to go before ousting the current downtrend.
AUD/NZD Chart, 4-Hour
AUD/NZD
Overview:
Last Price: 1.0656
Daily change: -10 pips
Daily change: -0.0938%
Daily Open: 1.0666
Trends:
Daily SMA20: 1.0769
Daily SMA50: 1.0853
Daily SMA100: 1.0898
Daily SMA200: 1.0817
Levels:
Daily High: 1.0697
Daily Low: 1.0641
Weekly High: 1.0741
Weekly Low: 1.0613
Monthly High: 1.0994
Monthly Low: 1.0723
Daily Fibonacci 38.2%: 1.0675
Daily Fibonacci 61.8%: 1.0662
Daily Pivot Point S1: 1.0639
Daily Pivot Point S2: 1.0612
Daily Pivot Point S3: 1.0583
Daily Pivot Point R1: 1.0694
Daily Pivot Point R2: 1.0723
Daily Pivot Point R3: 1.075
