“¢ The digital currency added to last week’s bearish breakthrough a two-month-old consolidative trading range and plunged to its lowest level since Oct. 2017.
“¢ A sustained weakness below the $4,725-$4,700 region was seen as a key trigger for the bearish traders and the latest leg of a sudden slump since the Asian session.
“¢ However, near-term oversold conditions helped recover a part of early steep losses, though seemed lacking any strong follow-through beyond $4,400 round figure mark.
“¢ The price action suggests that any attempted recovery is more likely to get sold into and a fall to Sept. 2017 lows, around the $2,975 region, remains a distinct possibility.
Bitcoin daily chart
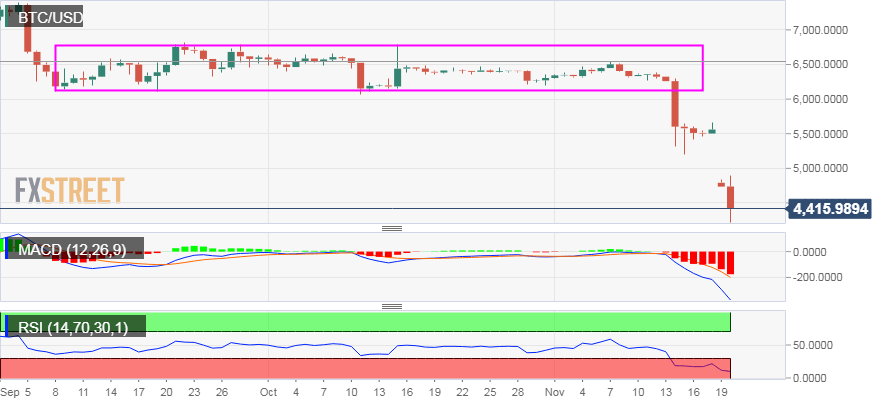
BTC/USD
Overview:
Last Price: 4428.11
Daily change: -3.1e+4 pips
Daily change: -6.51%
Daily Open: 4736.25
Trends:
Daily SMA20: 6081.36
Daily SMA50: 6283.43
Daily SMA100: 6433.24
Daily SMA200: 6878.95
Levels:
Daily High: 5560.48
Daily Low: 4684.31
Weekly High: 6383.15
Weekly Low: 5198.31
Monthly High: 6783.05
Monthly Low: 6060.88
Daily Fibonacci 38.2%: 5019
Daily Fibonacci 61.8%: 5225.78
Daily Pivot Point S1: 4426.88
Daily Pivot Point S2: 4117.5
Daily Pivot Point S3: 3550.7
Daily Pivot Point R1: 5303.05
Daily Pivot Point R2: 5869.85
Daily Pivot Point R3: 6179.22
