EUR/USD 4-hour chart
- EUR/USD is trading below the 200-period simple moving average on the 4-hour chart.
- The next main target to the downside for the coming days remains at the 1.1350 level.
-636783270764001139.png)
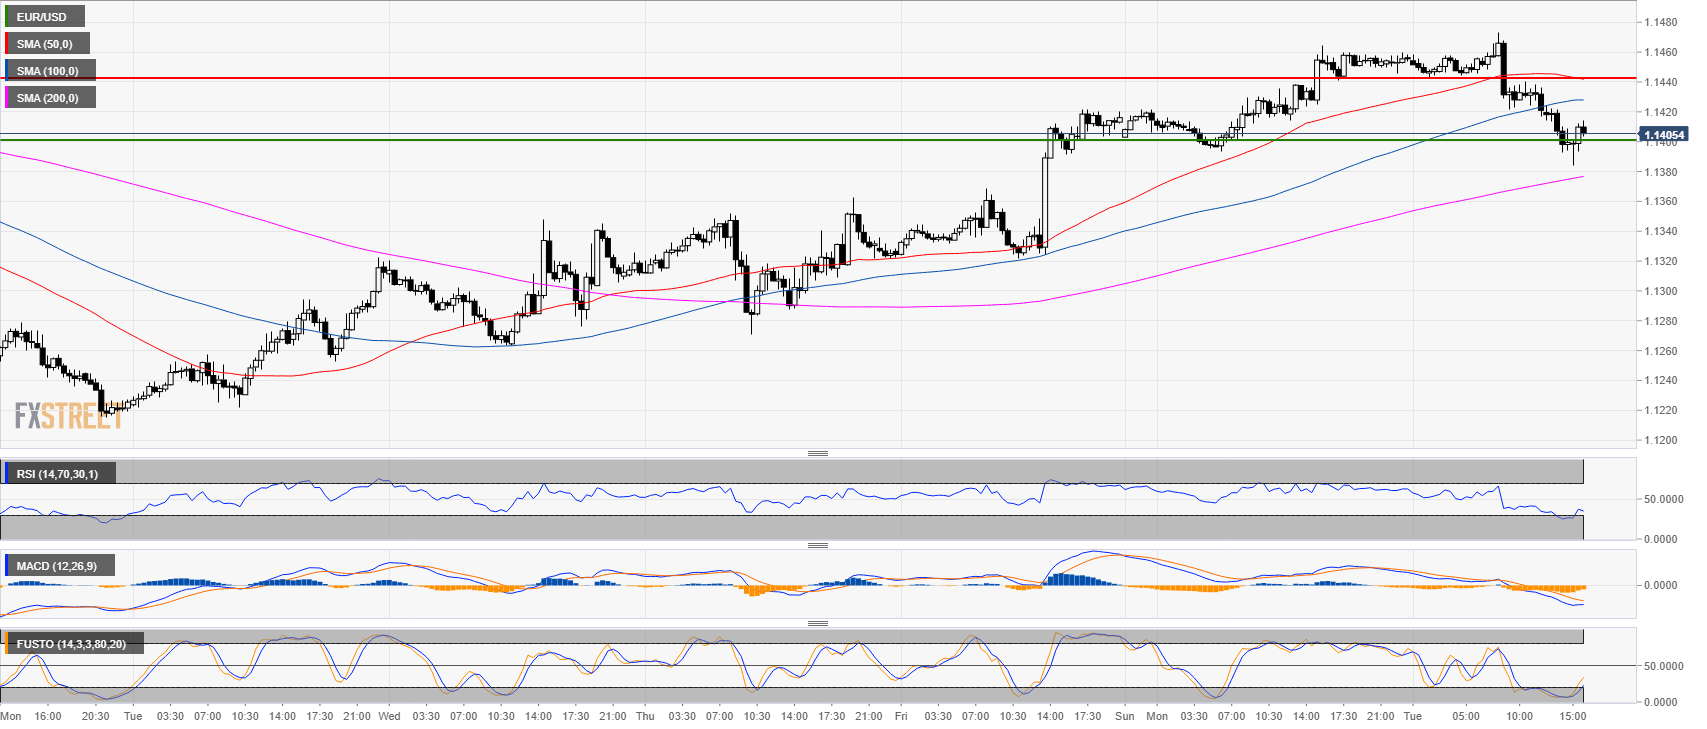
EUR/USD 30-minute chart
- EUR/USD found some short-term support at 1.1400 figure above the 200 SMA on the 30-minute chart.
- Technical indicators such as RSI and MACD have been pretty much oversold while MACD is slowly picking up steam.
- Traders should expect a test of 1.1440 before the resumption of the bear trend.
Additional key levels at a glance:
EUR/USD
Overview:
Last Price: 1.141
Daily change: -42 pips
Daily change: -0.367%
Daily Open: 1.1452
Trends:
Daily SMA20: 1.1374
Daily SMA50: 1.1509
Daily SMA100: 1.1561
Daily SMA200: 1.1811
Levels:
Daily High: 1.1466
Daily Low: 1.1394
Weekly High: 1.142
Weekly Low: 1.1216
Monthly High: 1.1625
Monthly Low: 1.1302
Daily Fibonacci 38.2%: 1.1438
Daily Fibonacci 61.8%: 1.1421
Daily Pivot Point S1: 1.1409
Daily Pivot Point S2: 1.1365
Daily Pivot Point S3: 1.1336
Daily Pivot Point R1: 1.1481
Daily Pivot Point R2: 1.1509
Daily Pivot Point R3: 1.1553
