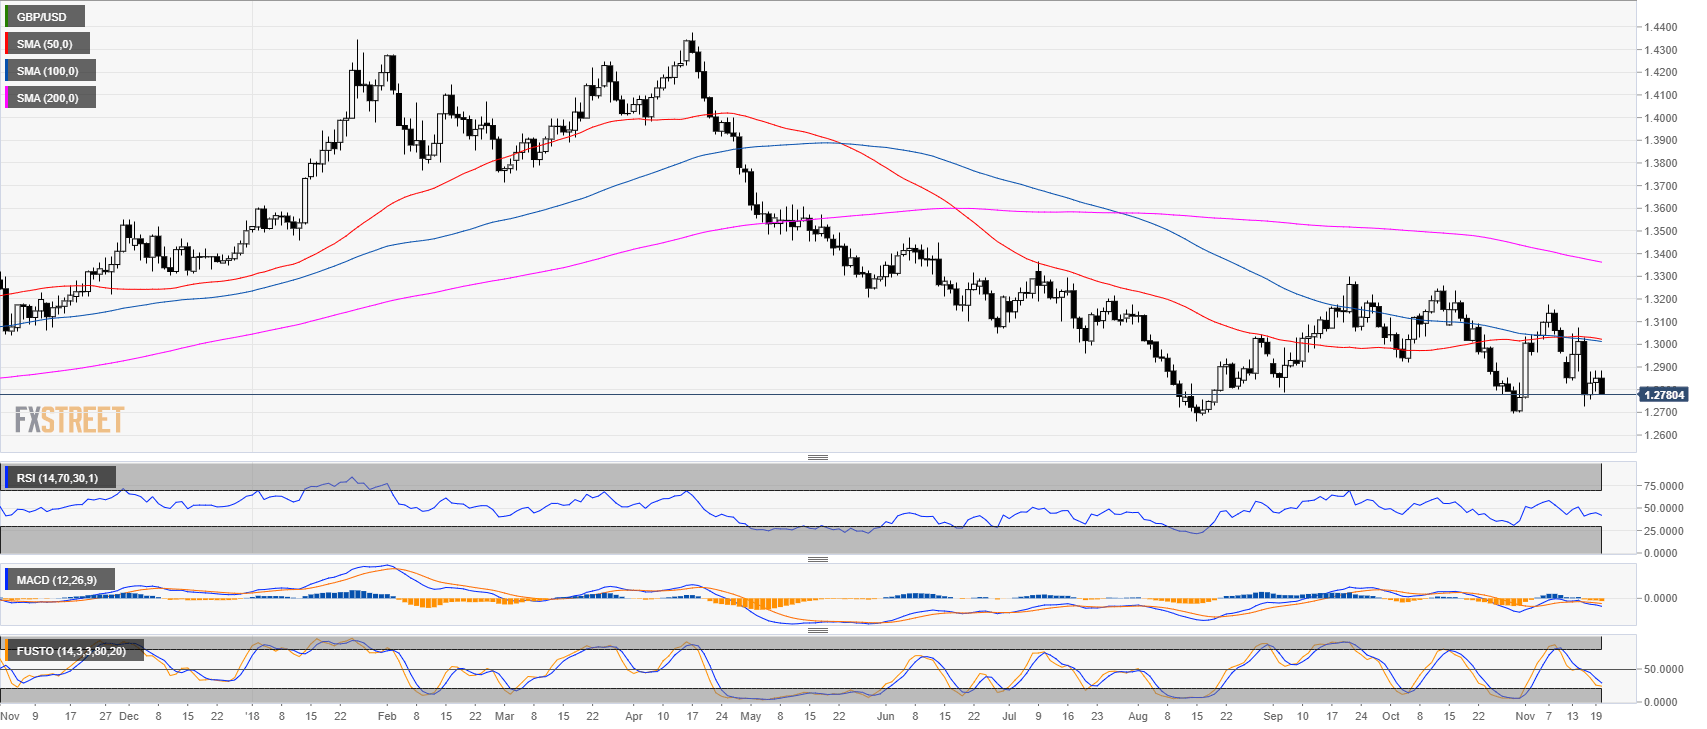
GBP/USD daily chart
- GBP/USD is trading in a bear trend below its main simple moving averages (SMA).
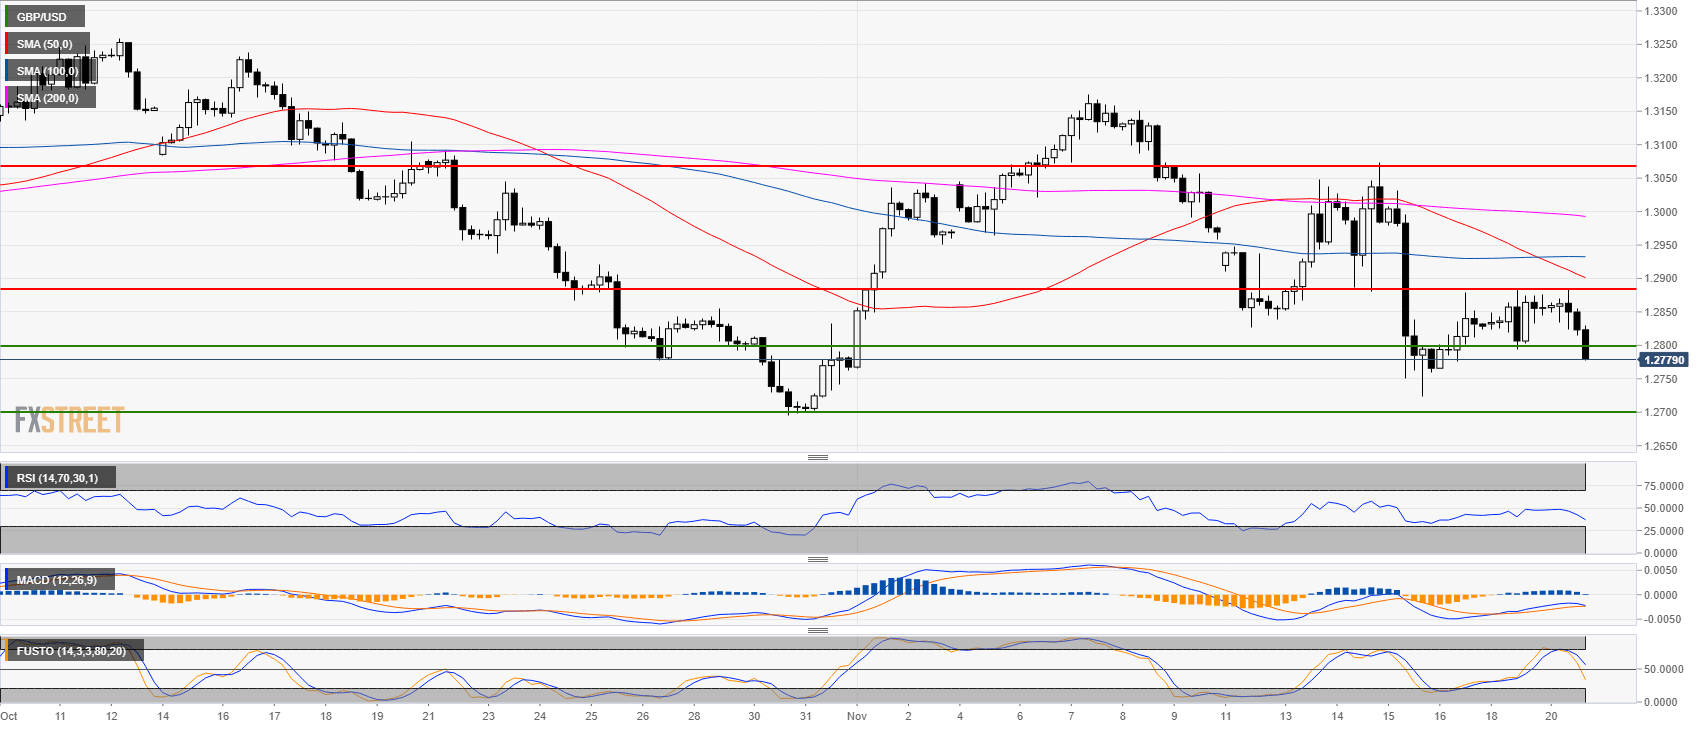
GBP/USD 4-hour chart
- GBP/USD broke below the 1.2800 figure opening the gates to the 1.2700 level.
- Technical indicators are weak suggesting continued bearish pressure.
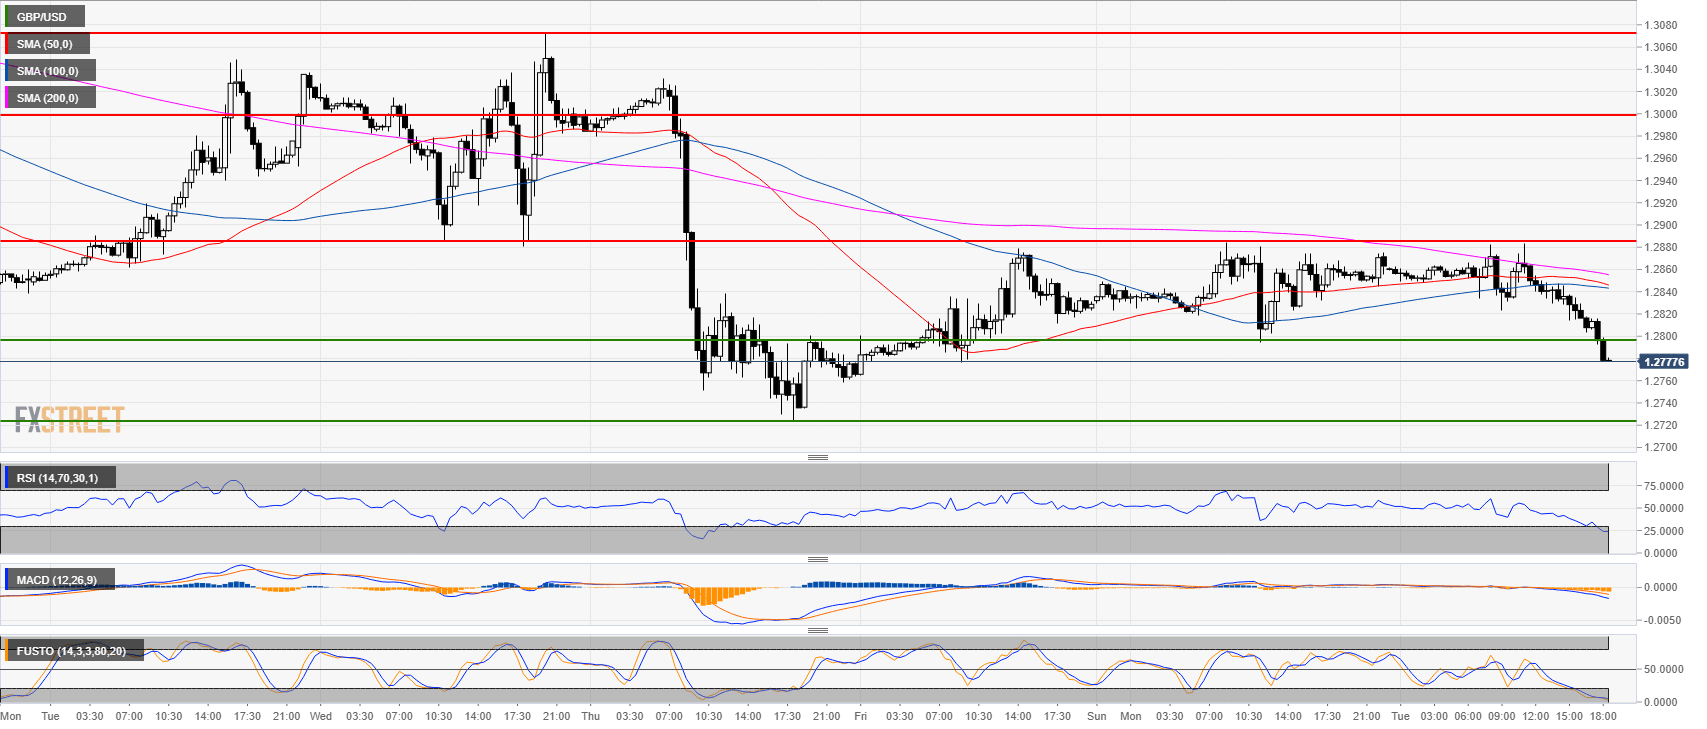
GBP/USD 30-minute chart
- GBP/USD is trading below its main SMA.
- Technical indicators are in negative territories.
Additional key levels at a glance:
GBP/USD
Overview:
Last Price: 1.2778
Daily change: -72 pips
Daily change: -0.560%
Daily Open: 1.285
Trends:
Daily SMA20: 1.2916
Daily SMA50: 1.3027
Daily SMA100: 1.3016
Daily SMA200: 1.3369
Levels:
Daily High: 1.2885
Daily Low: 1.2794
Weekly High: 1.3074
Weekly Low: 1.2724
Monthly High: 1.326
Monthly Low: 1.2696
Daily Fibonacci 38.2%: 1.285
Daily Fibonacci 61.8%: 1.2829
Daily Pivot Point S1: 1.2802
Daily Pivot Point S2: 1.2753
Daily Pivot Point S3: 1.2711
Daily Pivot Point R1: 1.2892
Daily Pivot Point R2: 1.2933
Daily Pivot Point R3: 1.2982
