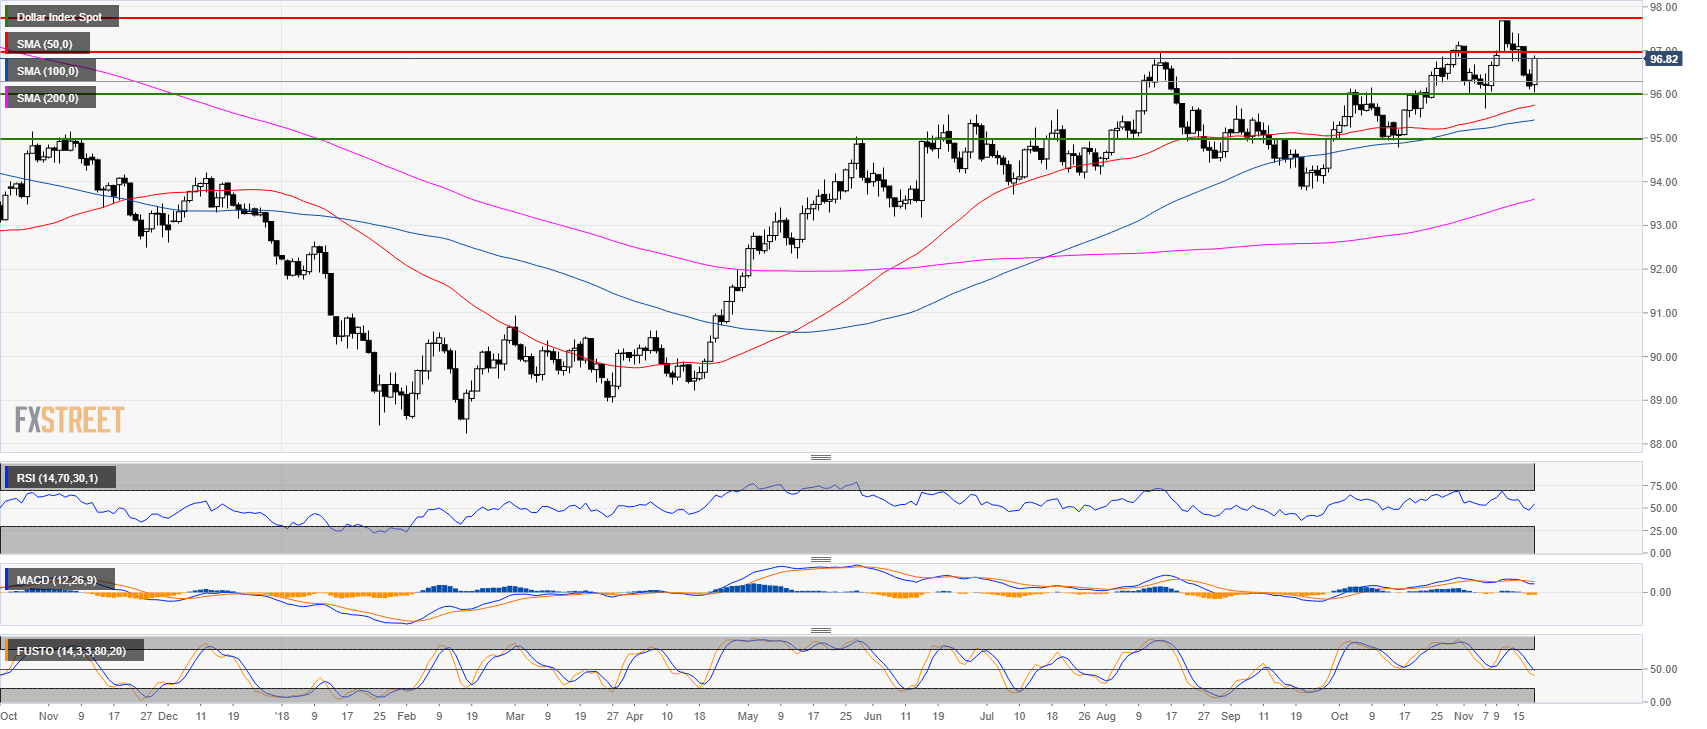
The US Dollar Index (DXY) daily chart
- DXY is trading in a bull trend above the 200-day simple moving average (SMA).
- As it was expected, the 5-wave Elliot pattern sent DXY near 96.00 figure.
- If DXY fails to sustain prices above 97.00 in the coming days then 96.00 can be back on the table with a potential extension down to 95.00. On the flip side, a continuation past 97.00 should open the doors to 97.70.
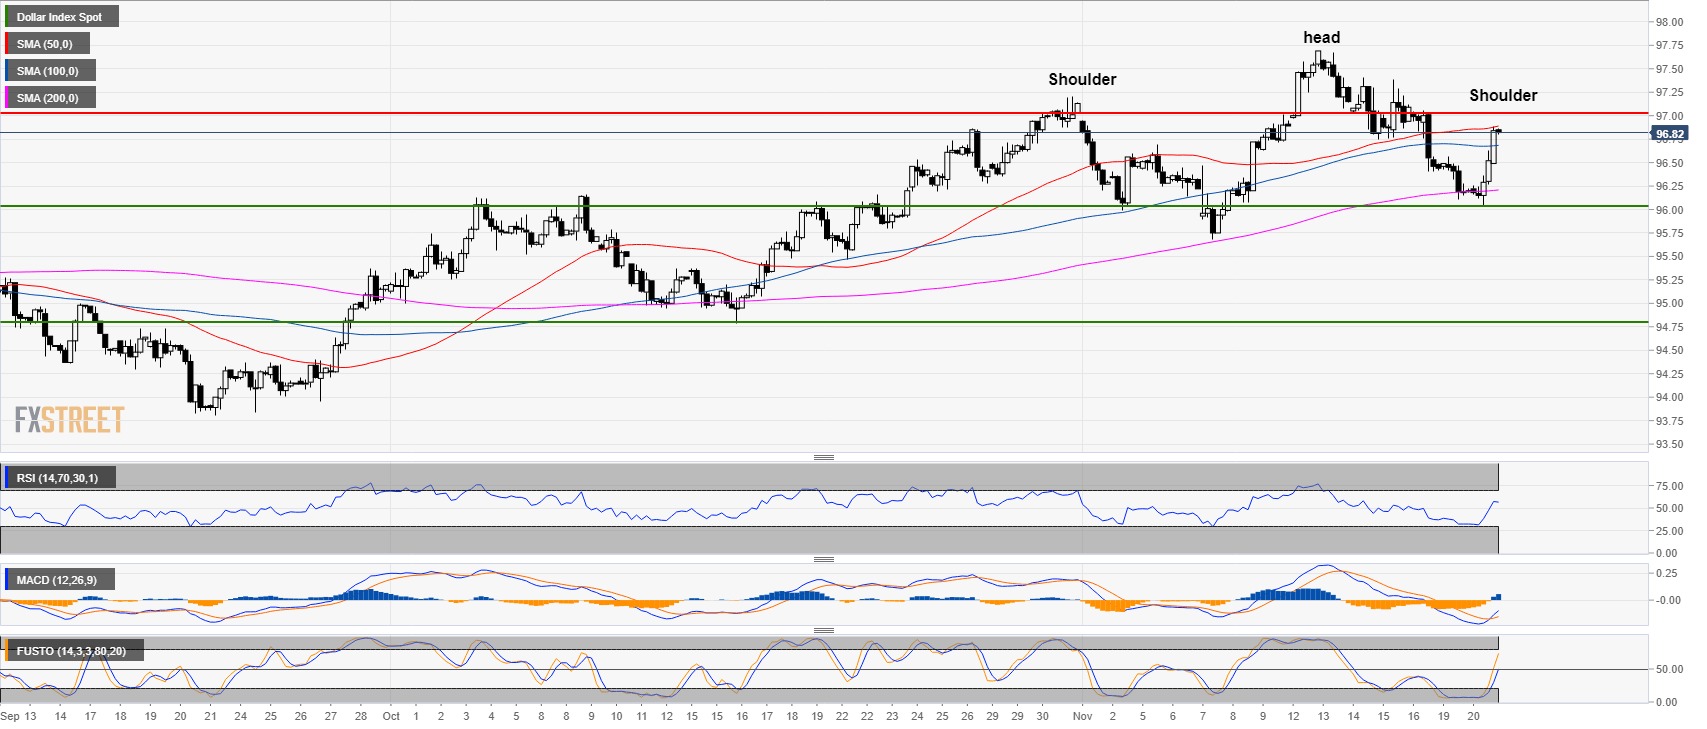
DXY 4-hour chart
- DXY is finding resistance at the 50 SMA.
- Technical indicators are bullish. If bulls can break above 97.00 on a daily closing basis they have a chance to get to the 2018 high.
- Otherwise, the head-and-shoulders pattern might enter into play and send DXY down.
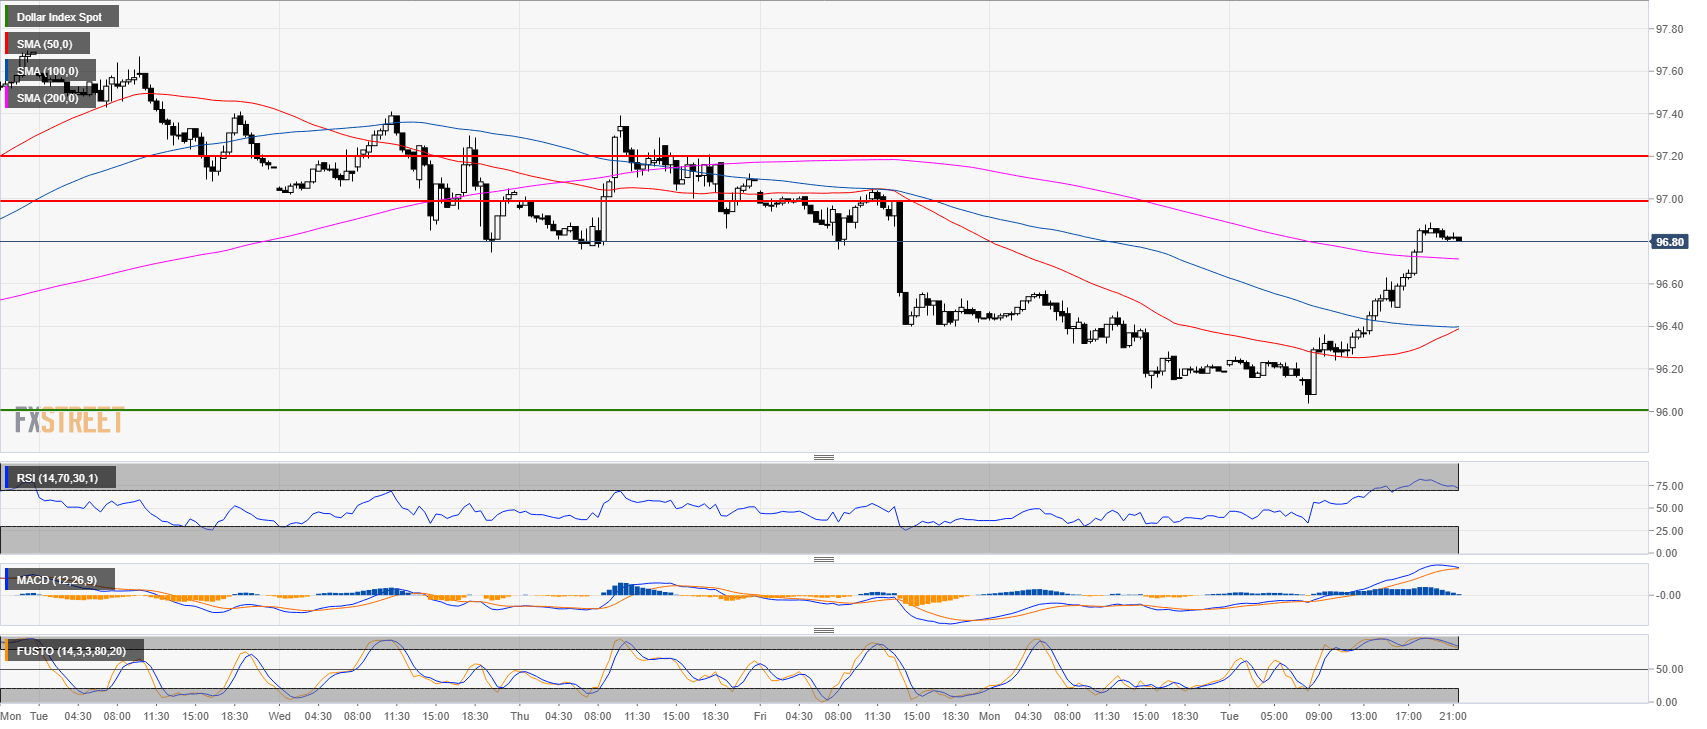
DXY 30-minute chart
- DXY broke above its main SMAs as the RSI and Stochastic indicators are in overbought territories.
- 97.00 and 97.20 should act as very strong resistance.
Additional levels at aglance:
Dollar Index Spot
Overview:
Last Price: 96.82
Daily change: 63 pips
Daily change: 0.655%
Daily Open: 96.19
Trends:
Daily SMA20: 96.64
Daily SMA50: 95.72
Daily SMA100: 95.39
Daily SMA200: 93.56
Levels:
Daily High: 96.57
Daily Low: 96.11
Weekly High: 97.7
Weekly Low: 96.4
Monthly High: 97.2
Monthly Low: 94.79
Daily Fibonacci 38.2%: 96.29
Daily Fibonacci 61.8%: 96.39
Daily Pivot Point S1: 96.01
Daily Pivot Point S2: 95.83
Daily Pivot Point S3: 95.55
Daily Pivot Point R1: 96.47
Daily Pivot Point R2: 96.75
Daily Pivot Point R3: 96.93
