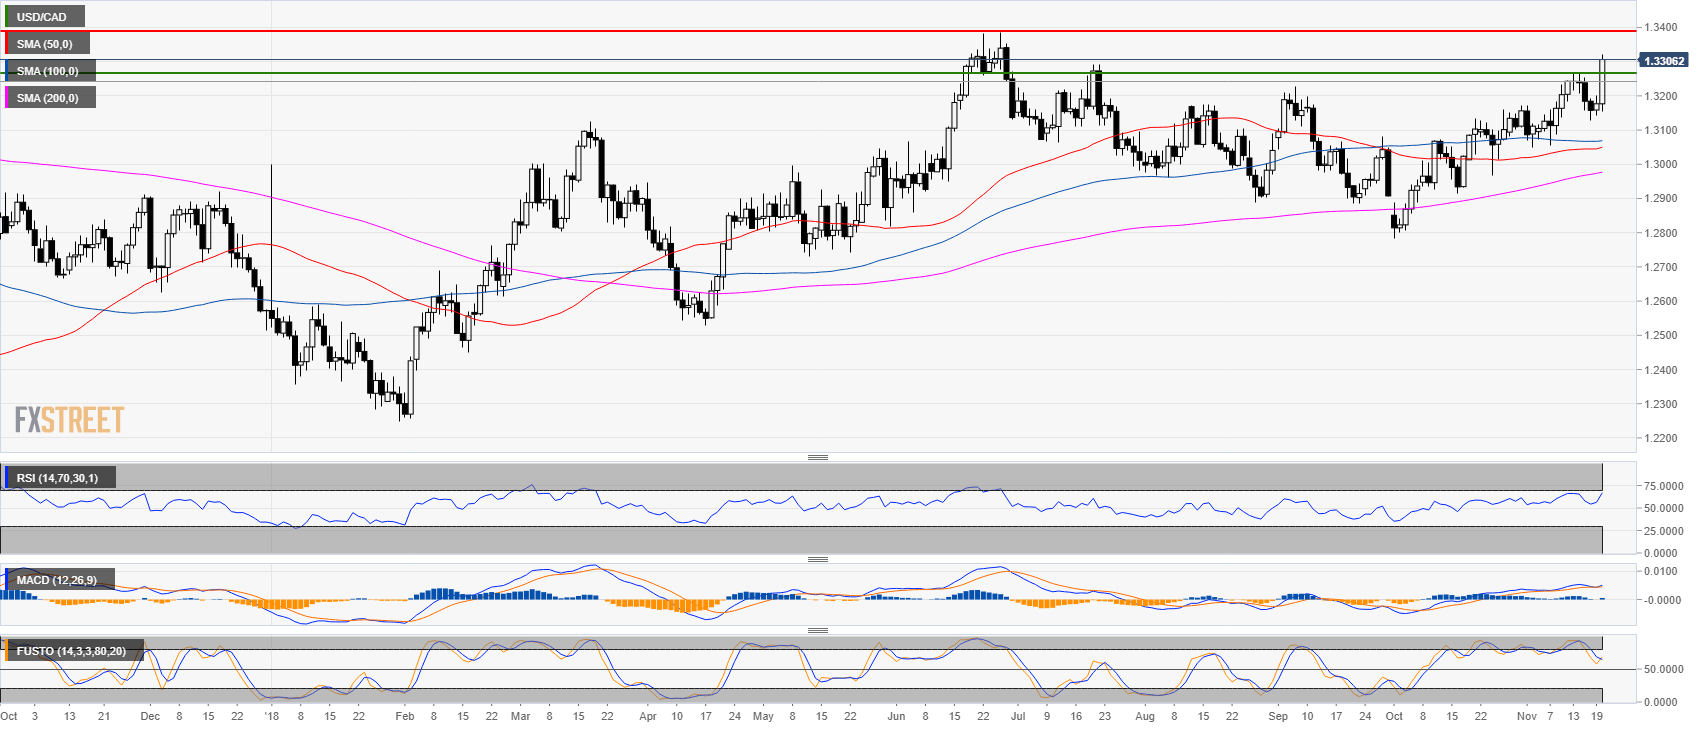
USD/CAD daily chart
- USD/CAD is trading in a bull trend above the 200-day simple moving average.
- USD/CAD is reaching levels not seen since June 2018.
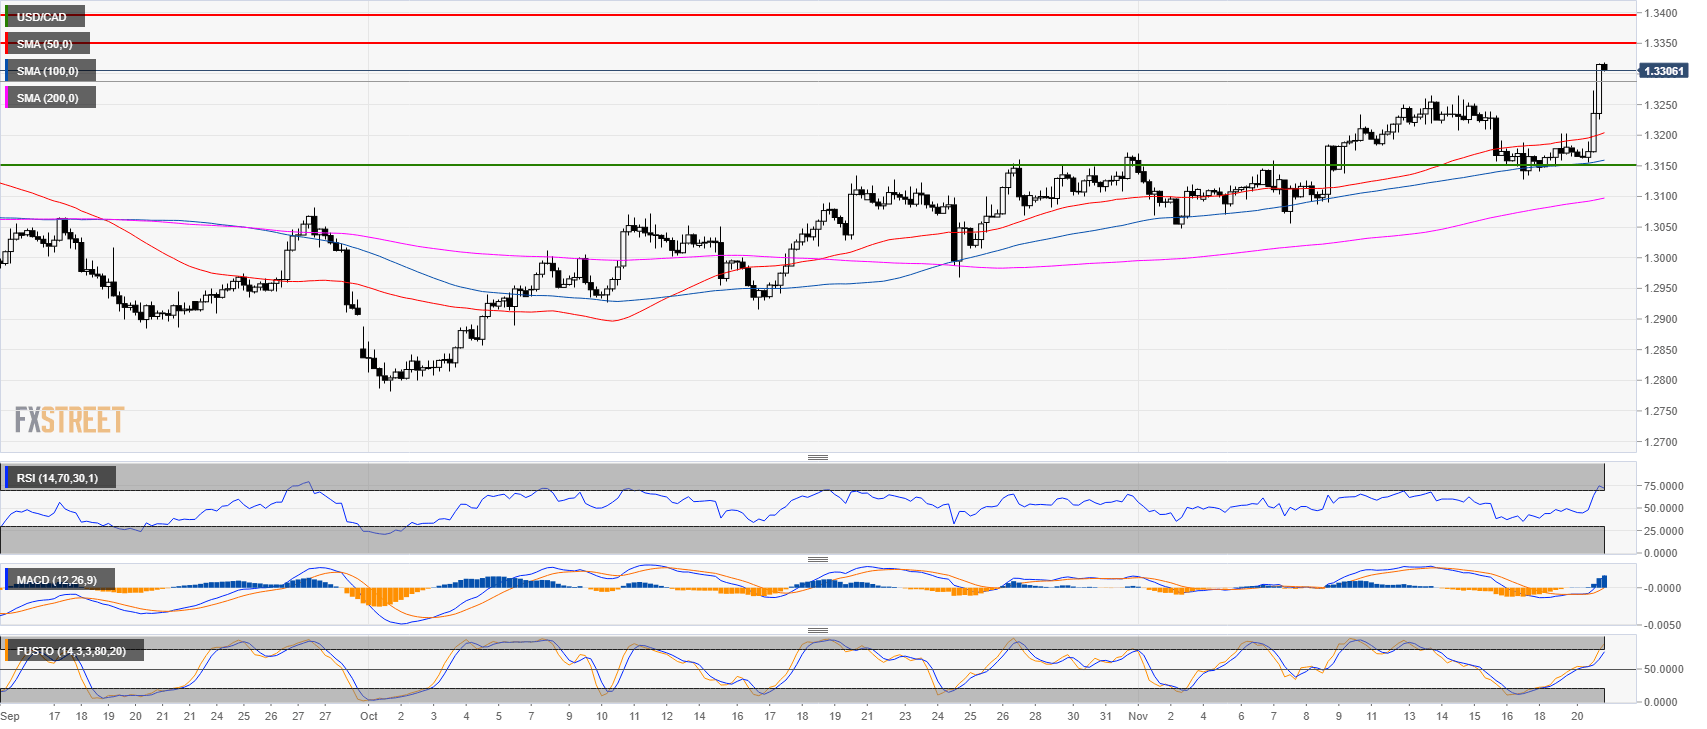
USD/CAD 4-hour chart
- Resistances are seen at 1.3350 and 1.1400 figure.
- The RSI and Stochastic are already in the overbought zone.
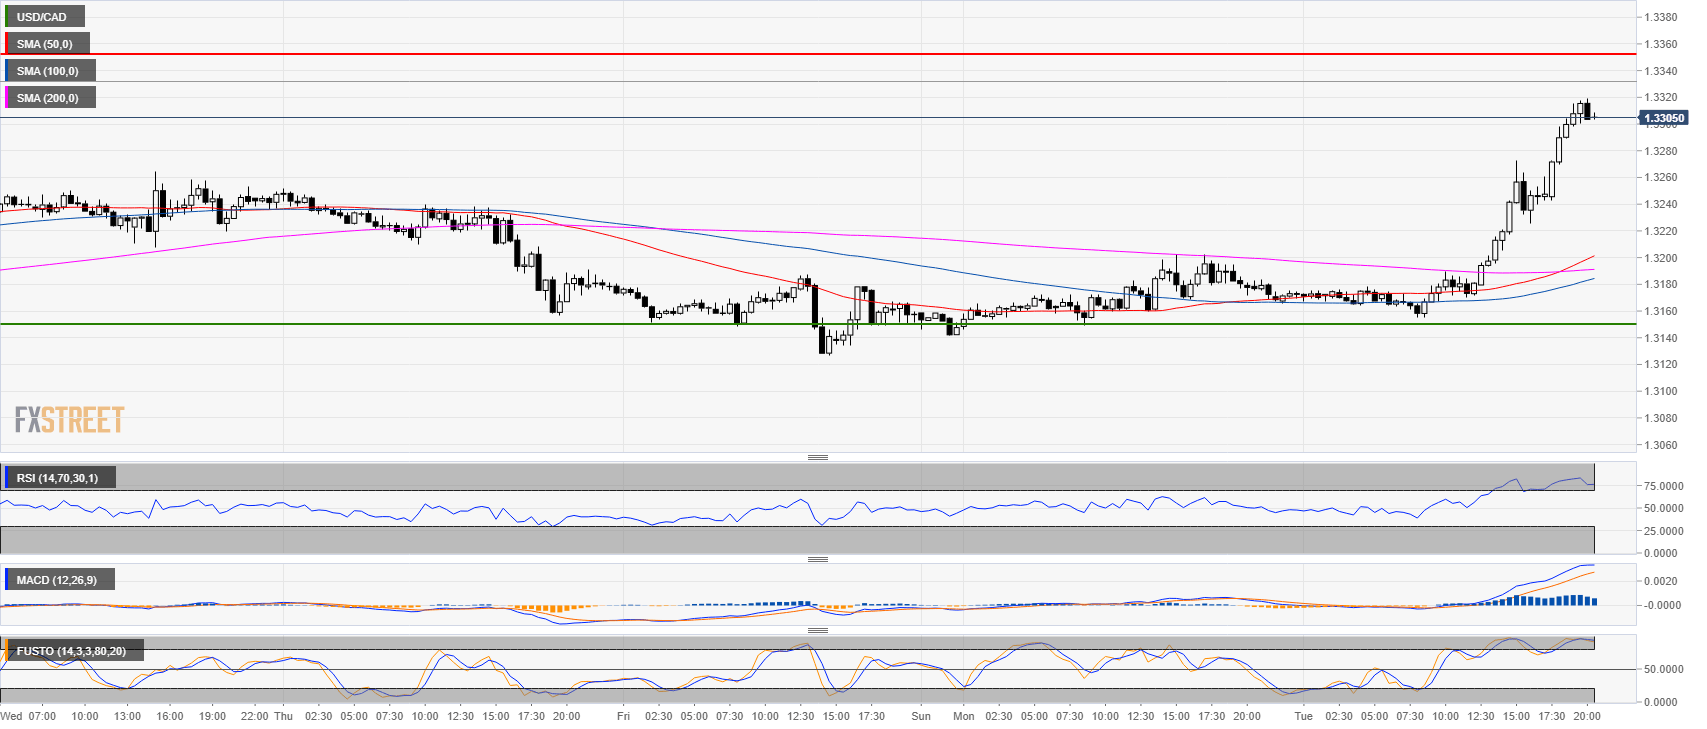
USD/CAD 30-minute chart
- USD/CAD had a strong bull leg on Tuesday.
- The RSI and Stochastic are overbought.
- There might be room for a potential extension to 1.3350 but it remains to be seen if bulls have enough fuel to break above that level.
Additional key levels at a glance:
USD/CAD
Overview:
Last Price: 1.3304
Daily change: 1.3e+2 pips
Daily change: 0.964%
Daily Open: 1.3177
Trends:
Daily SMA20: 1.3143
Daily SMA50: 1.3045
Daily SMA100: 1.3068
Daily SMA200: 1.297
Levels:
Daily High: 1.3202
Daily Low: 1.3142
Weekly High: 1.3264
Weekly Low: 1.3127
Monthly High: 1.3172
Monthly Low: 1.2783
Daily Fibonacci 38.2%: 1.3179
Daily Fibonacci 61.8%: 1.3165
Daily Pivot Point S1: 1.3145
Daily Pivot Point S2: 1.3113
Daily Pivot Point S3: 1.3084
Daily Pivot Point R1: 1.3206
Daily Pivot Point R2: 1.3235
Daily Pivot Point R3: 1.3267
