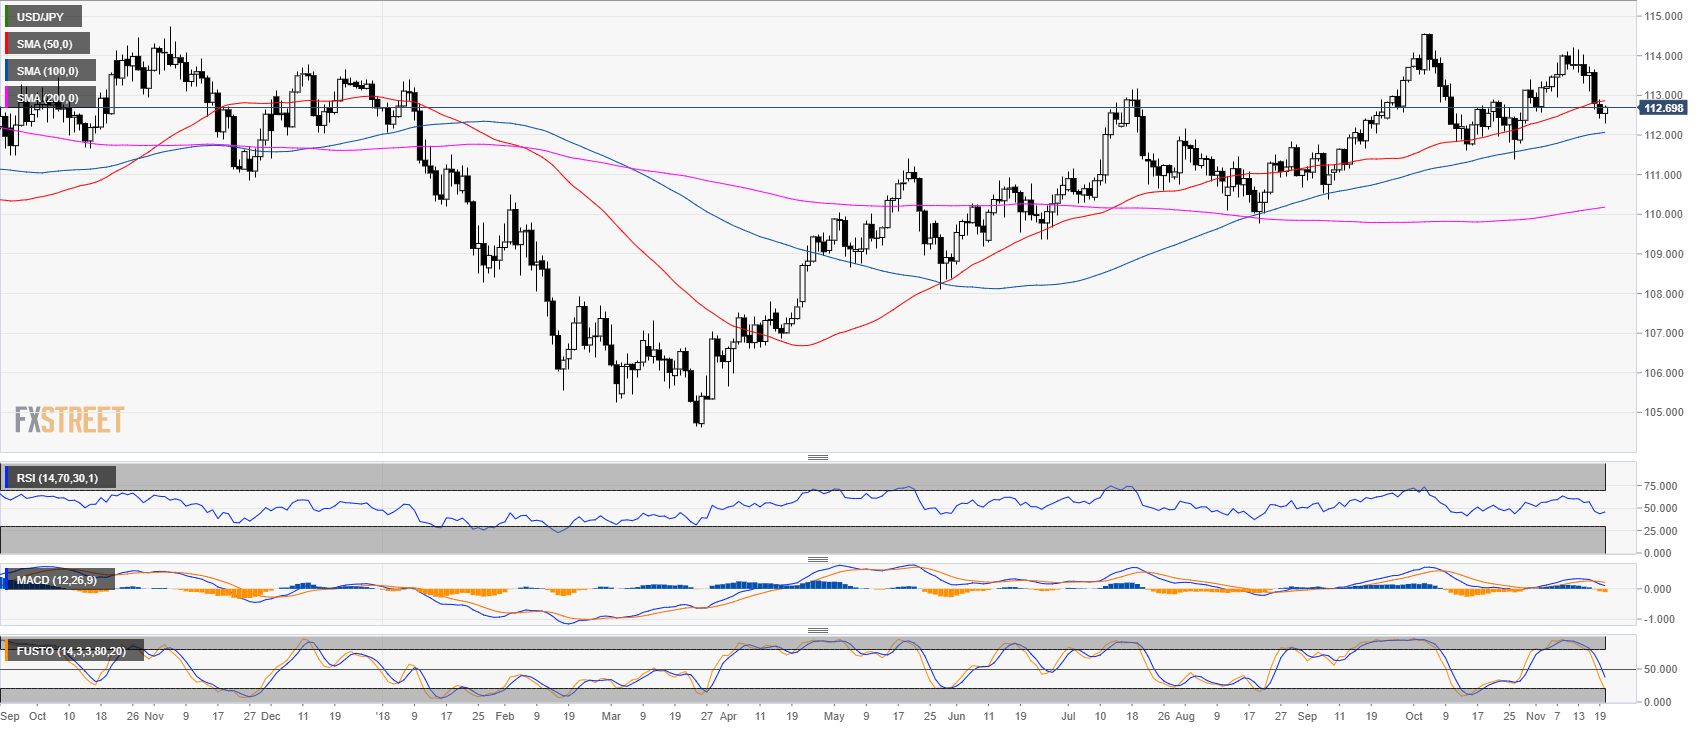
USD/JPY daily chart
- USD/JPY is trading just above the 112.00 figure and the 100-day simple moving average (SMA).
- Bulls want to break above the 113.00 figure and the 50 SMA.
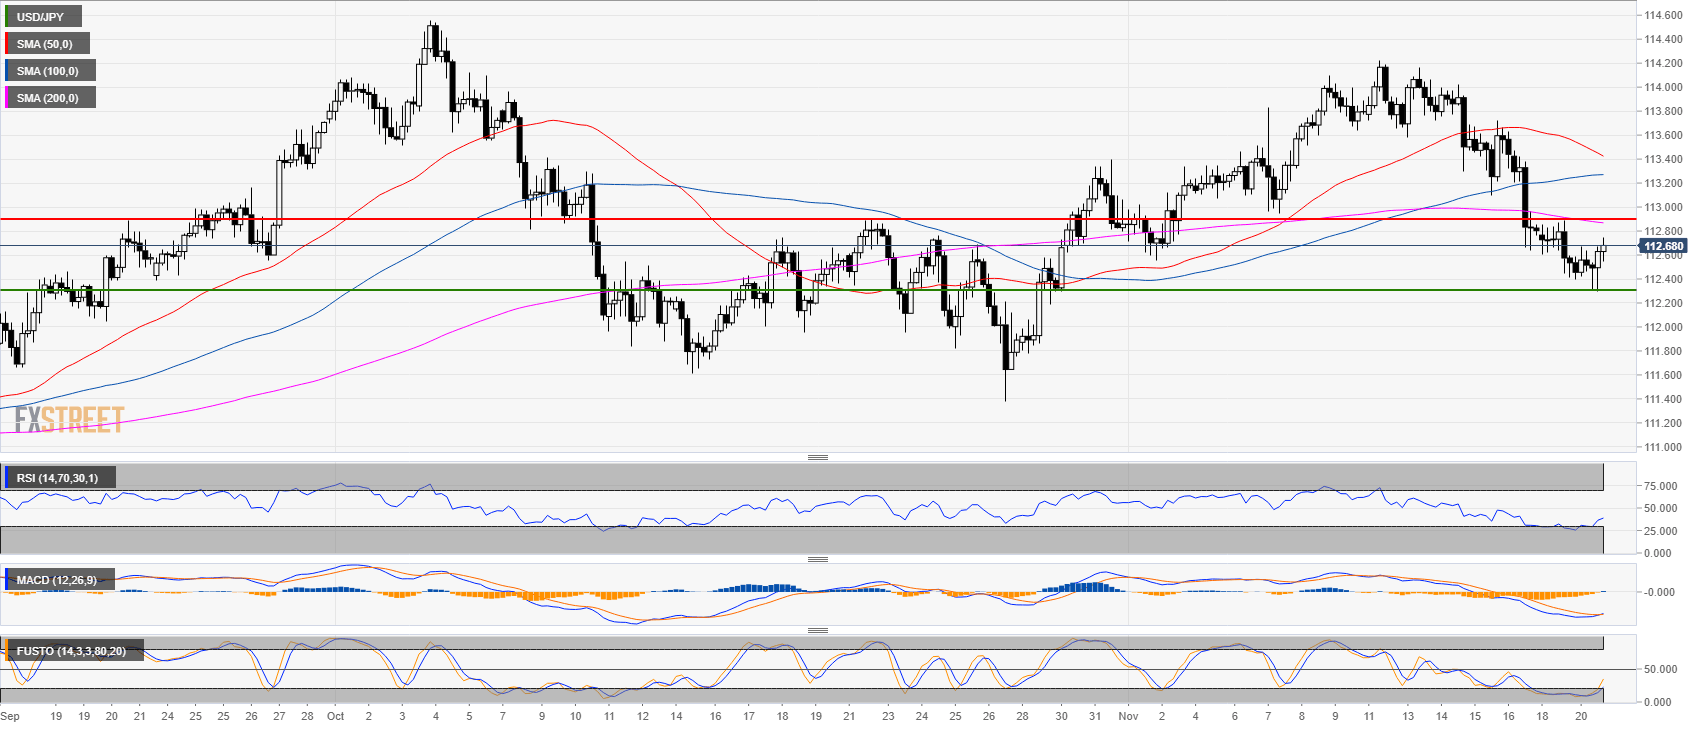
USD/JPY 4-hour chart
- USD/JPY is trading near the November lows.
- Bulls want a retest of 112.89, November 19 high.
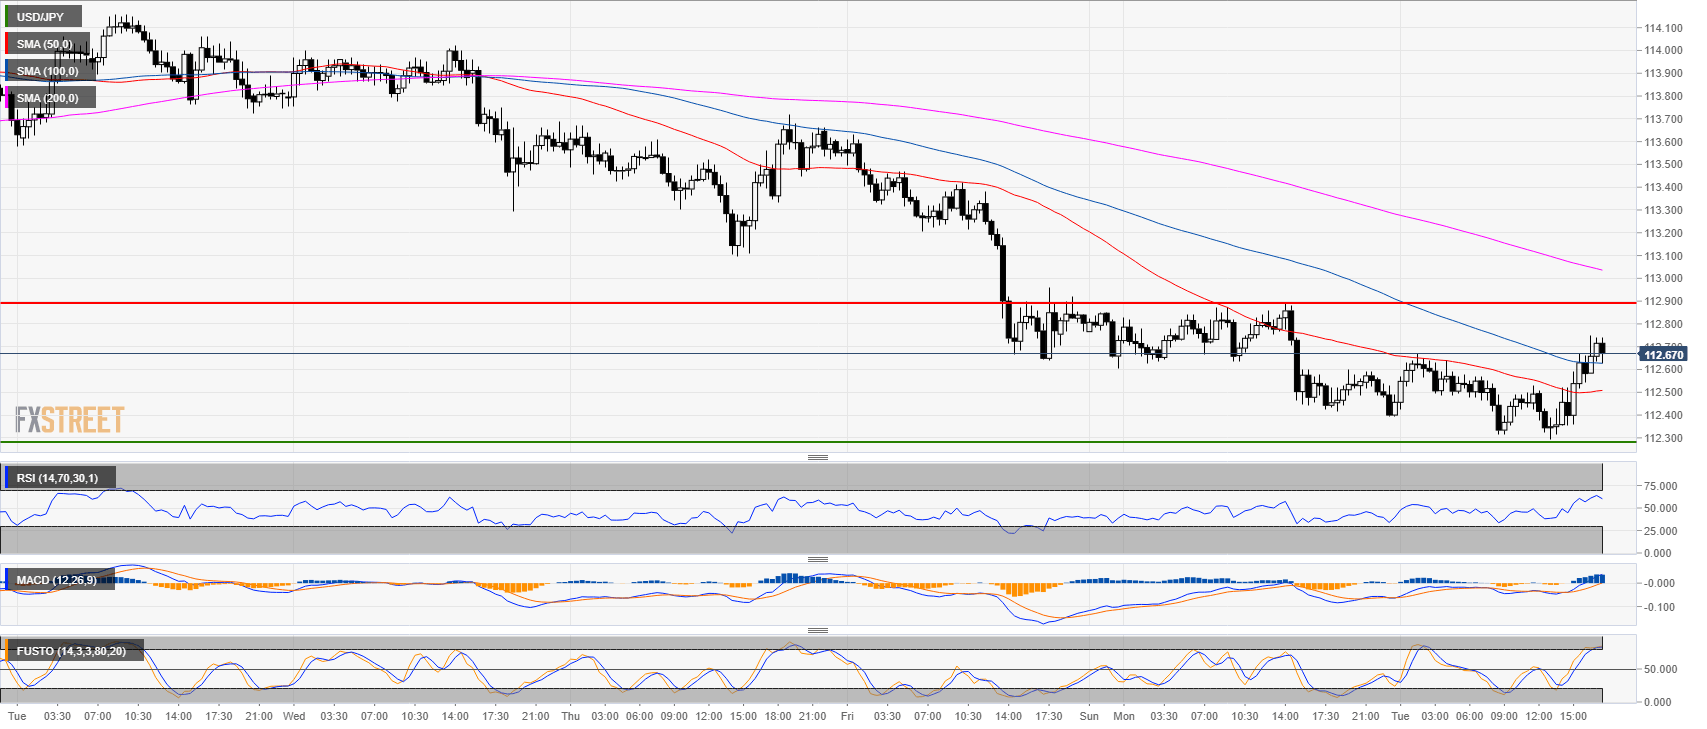
USD/JPY 30-minute chart
- USD/JPY reclaimed the 50 and 100 SMA but bulls would need to hold the market above the 112.30 level.
Additional key levels at a glance:
USD/JPY
Overview:
Last Price: 112.69
Daily change: 14 pips
Daily change: 0.124%
Daily Open: 112.55
Trends:
Daily SMA20: 113.07
Daily SMA50: 112.84
Daily SMA100: 112.05
Daily SMA200: 110.16
Levels:
Daily High: 112.89
Daily Low: 112.42
Weekly High: 114.22
Weekly Low: 112.64
Monthly High: 114.56
Monthly Low: 111.38
Daily Fibonacci 38.2%: 112.6
Daily Fibonacci 61.8%: 112.71
Daily Pivot Point S1: 112.34
Daily Pivot Point S2: 112.14
Daily Pivot Point S3: 111.87
Daily Pivot Point R1: 112.82
Daily Pivot Point R2: 113.09
Daily Pivot Point R3: 113.29
