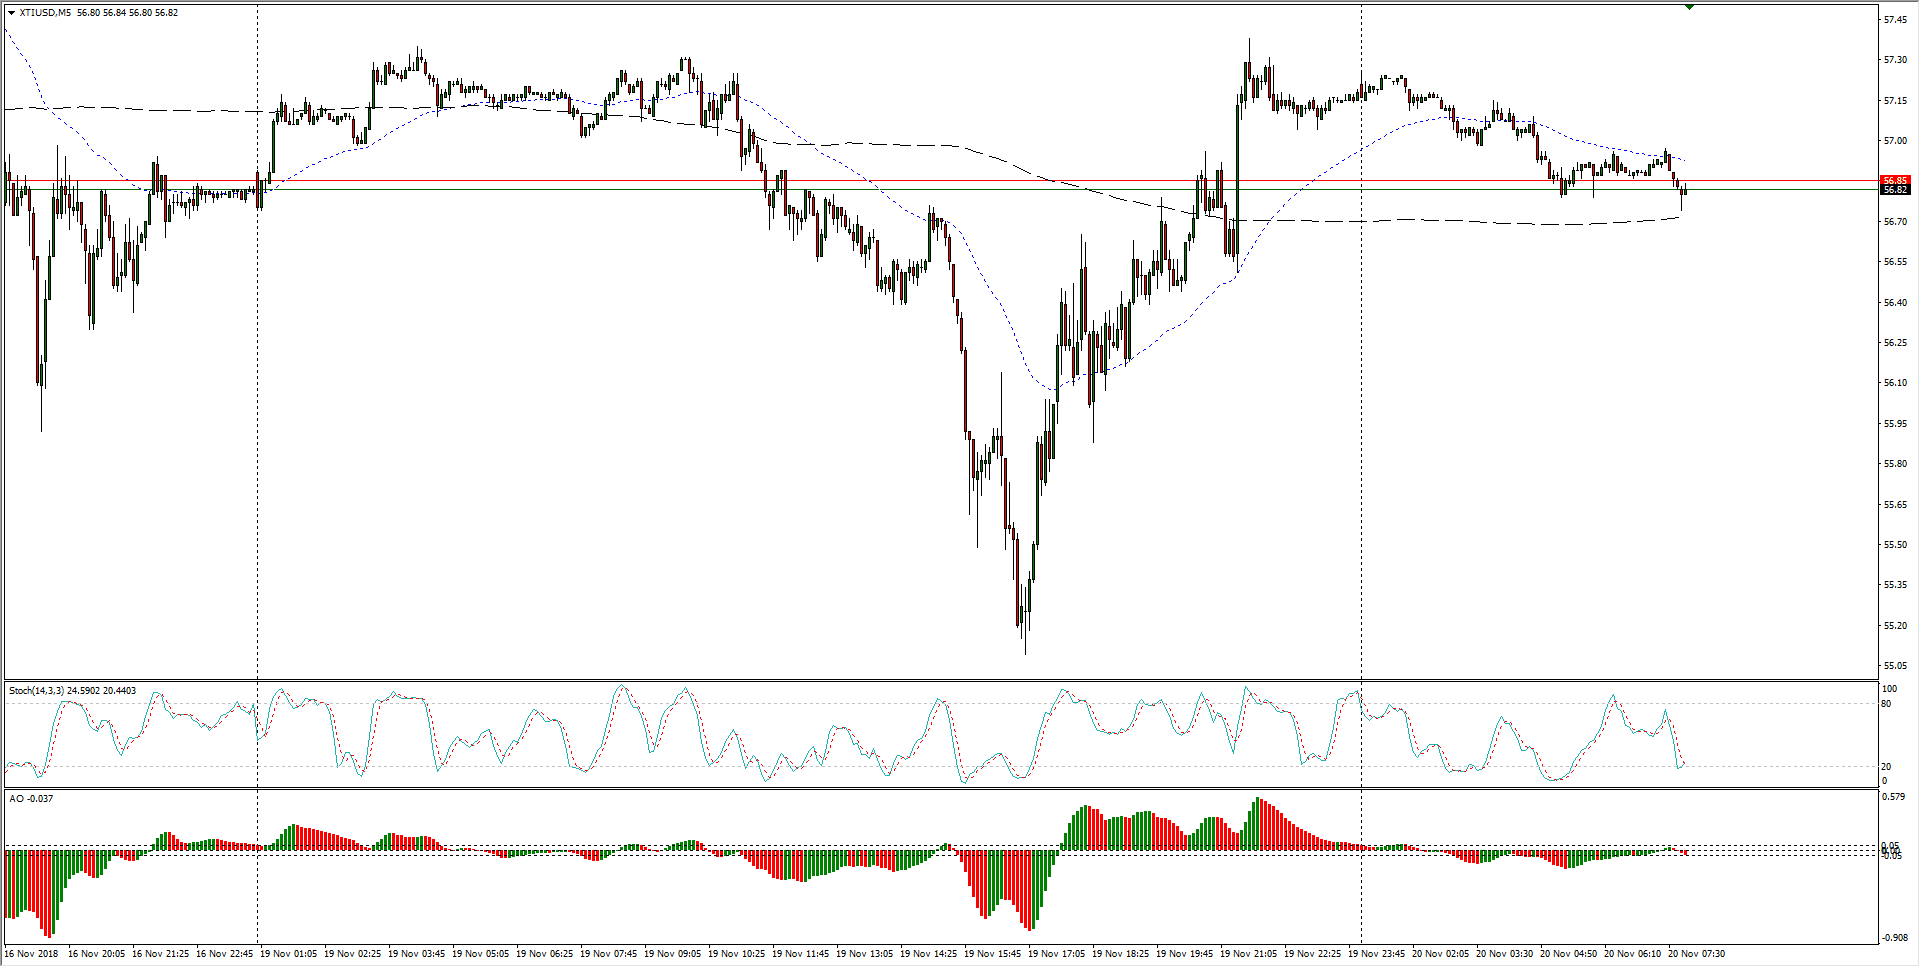
- The last twenty-four hours saw US crude dip into the 55.00 critical level before immediately rebounding to familiar resistance levels near 57.00.
WTI Chart, 5-Minute
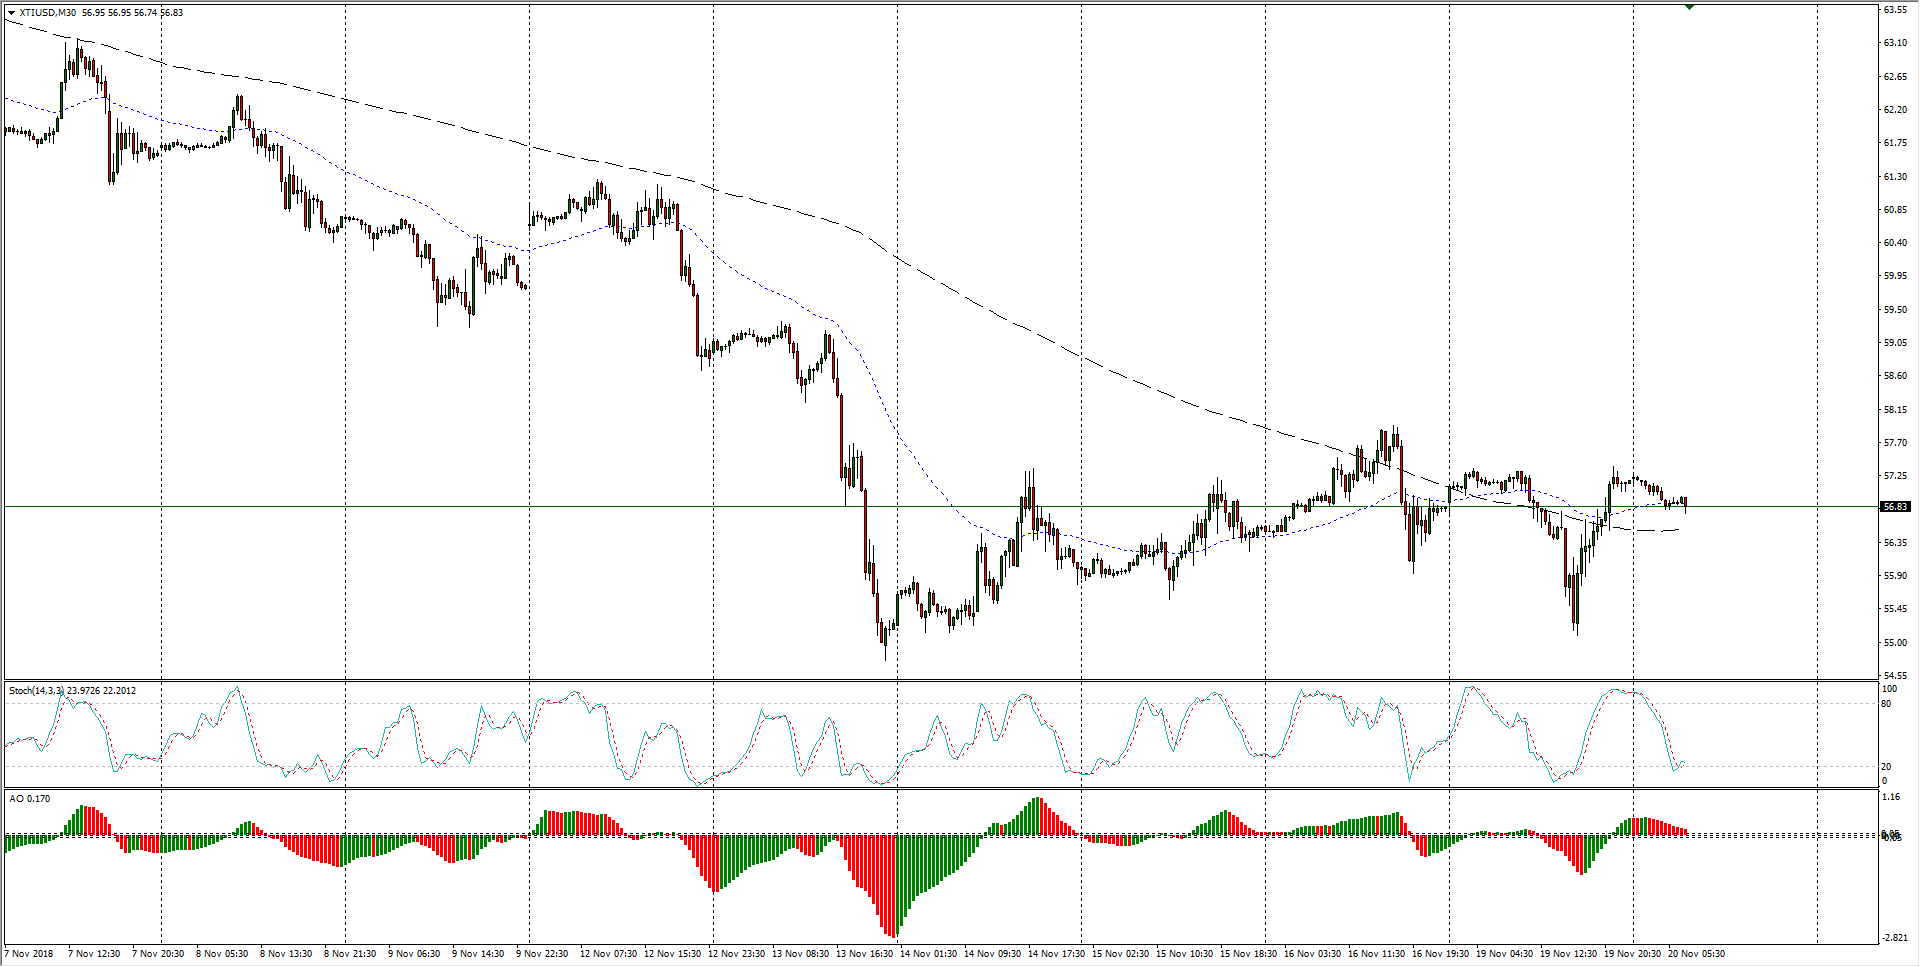
- Despite some shocks to the downside, American crude barrels are holding steadily above the near-term bottom at 54.75 as energies traders recover from several months of headline-fueled shock selling.
WTI Chart, 30-Minute
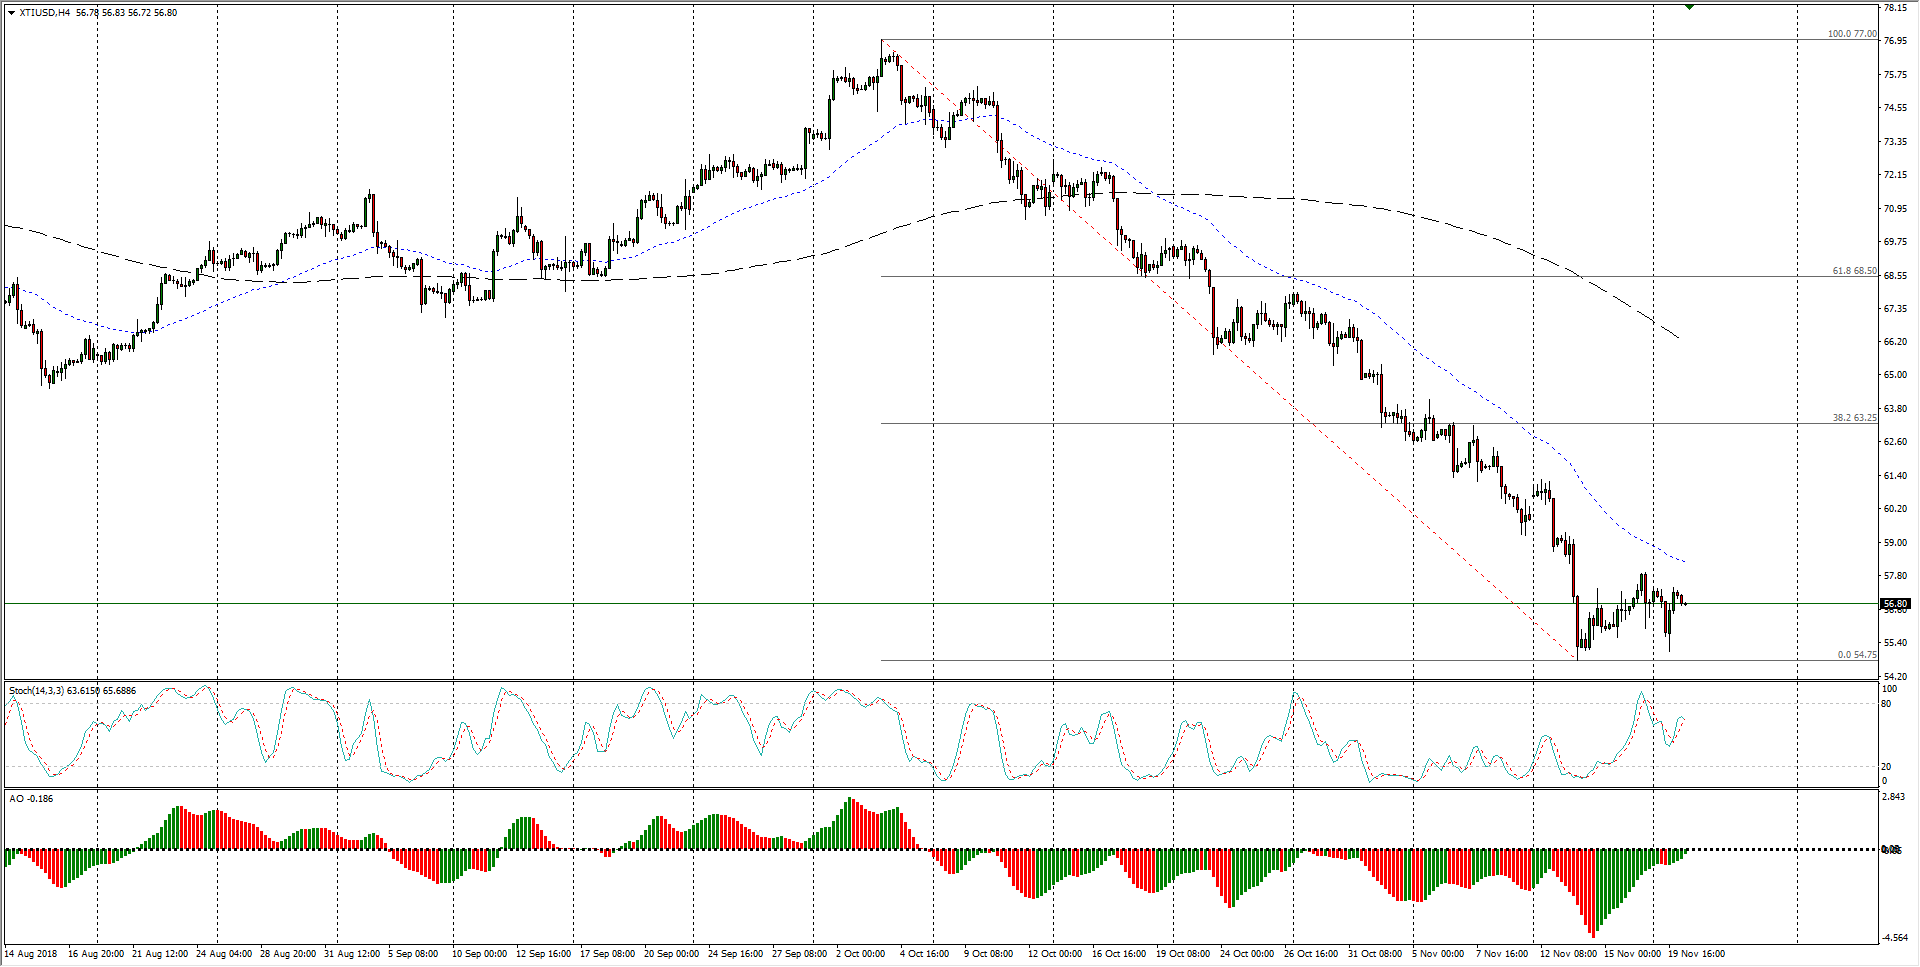
- WTI’s six-week decline shows just how far critical energy has declined, and even a straight bounce to the 38.2% Fibo retracement level at 63.25 will still see WTI maintain a bearish stance in the medium-term.
WTI Chart, 4-Hour
WTI
Overview:
Last Price: 56.99
Daily change: -37 pips
Daily change: -0.645%
Daily Open: 57.36
Trends:
Daily SMA20: 61.06
Daily SMA50: 67.43
Daily SMA100: 67.91
Daily SMA200: 68.19
Levels:
Daily High: 57.42
Daily Low: 57.3
Weekly High: 60.93
Weekly Low: 55.21
Monthly High: 76.25
Monthly Low: 64.86
Daily Fibonacci 38.2%: 57.37
Daily Fibonacci 61.8%: 57.35
Daily Pivot Point S1: 57.3
Daily Pivot Point S2: 57.24
Daily Pivot Point S3: 57.18
Daily Pivot Point R1: 57.42
Daily Pivot Point R2: 57.48
Daily Pivot Point R3: 57.54
