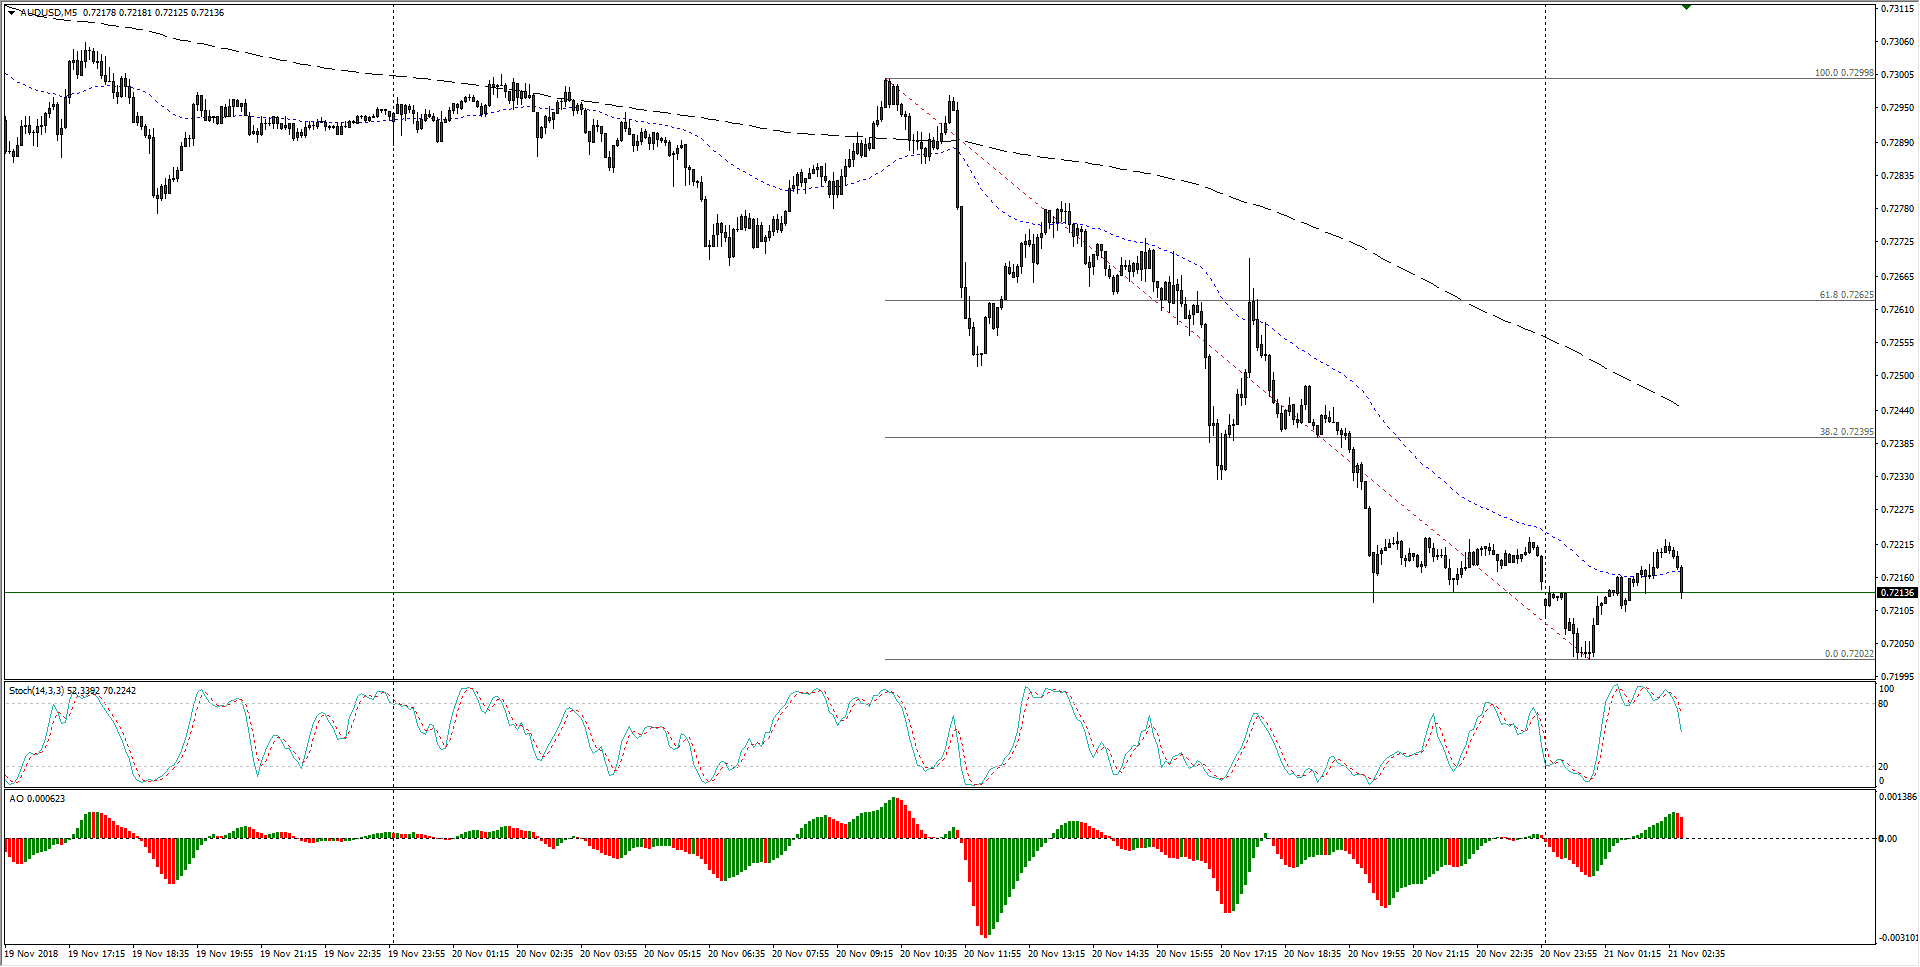
- Over the past twenty-four hours, the AUD/USD has shed value as broader markets opt for the Greenback instead of the risk-exposed Aussie, and risk-off flows see the pairing challenging the 0.7200 handle heading into Wednesday’s market action.
AUD/USD Chart, 5-Minute
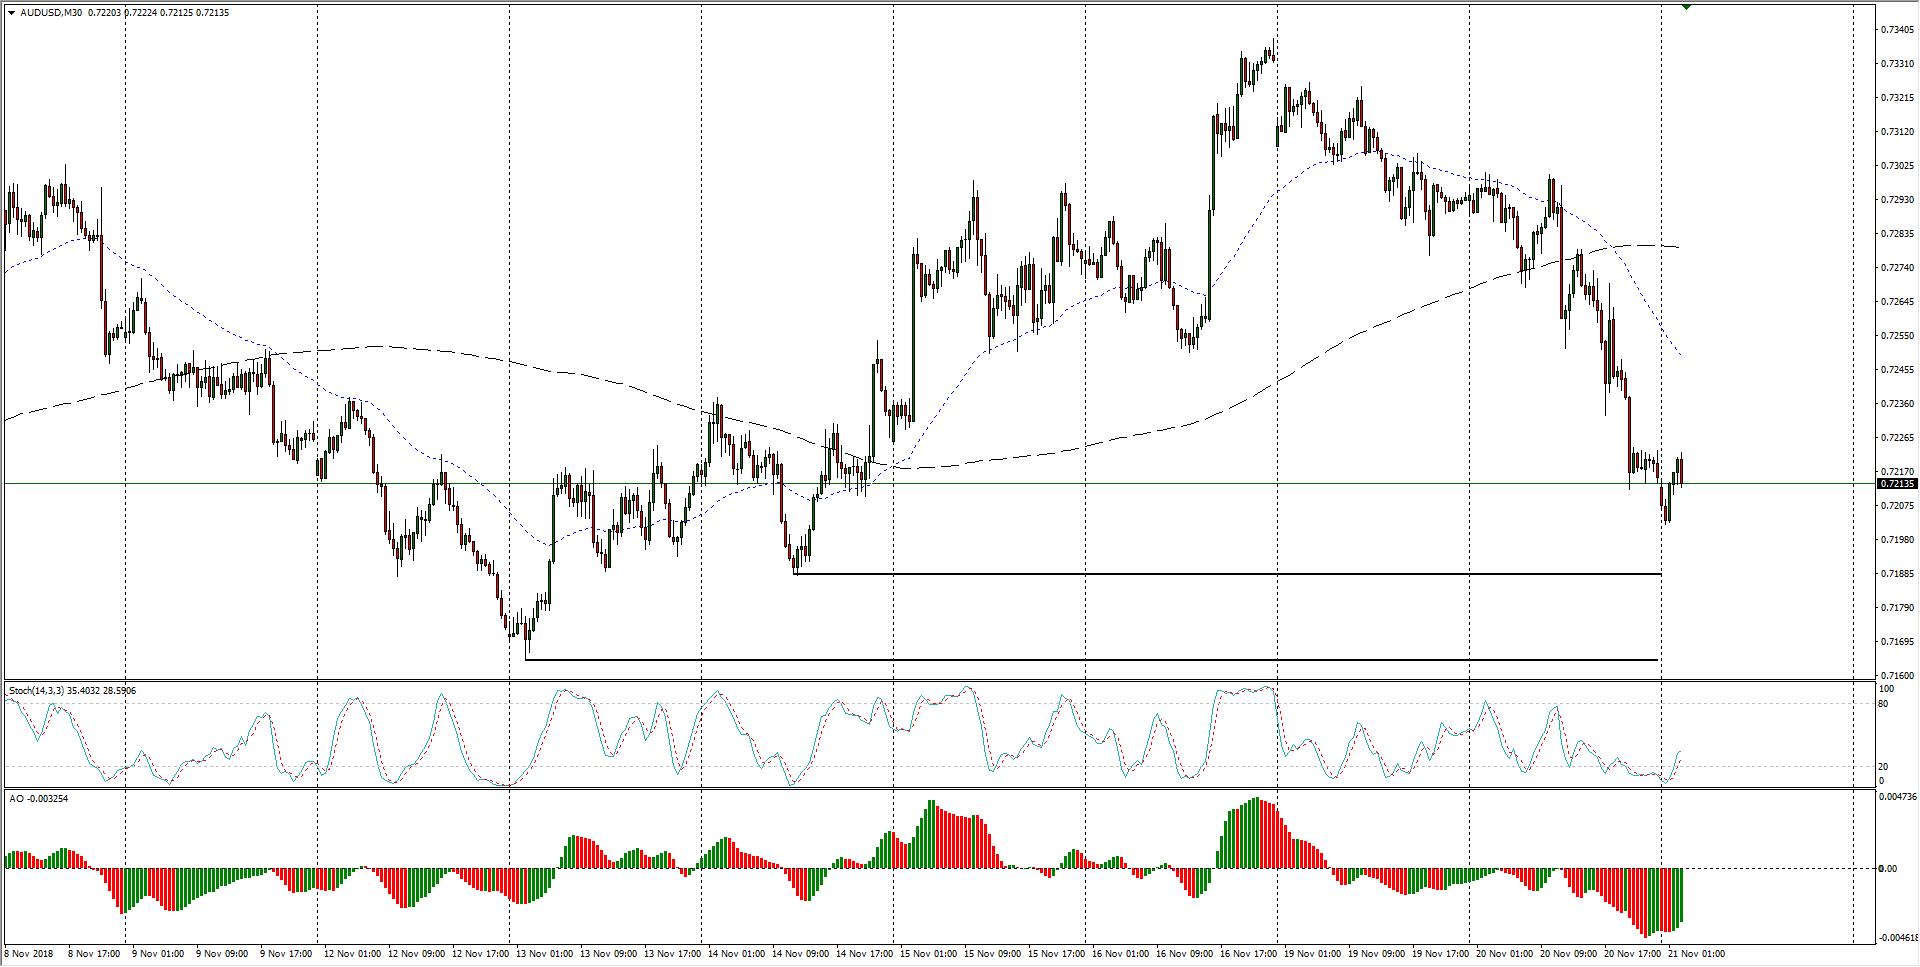
- The past two weeks shows the AUD/USD reversing key bullish momentum, with the current week accelerating losses as investors pull out of the China-exposed Aussie.
AUD/USD Chart, 30-Minute
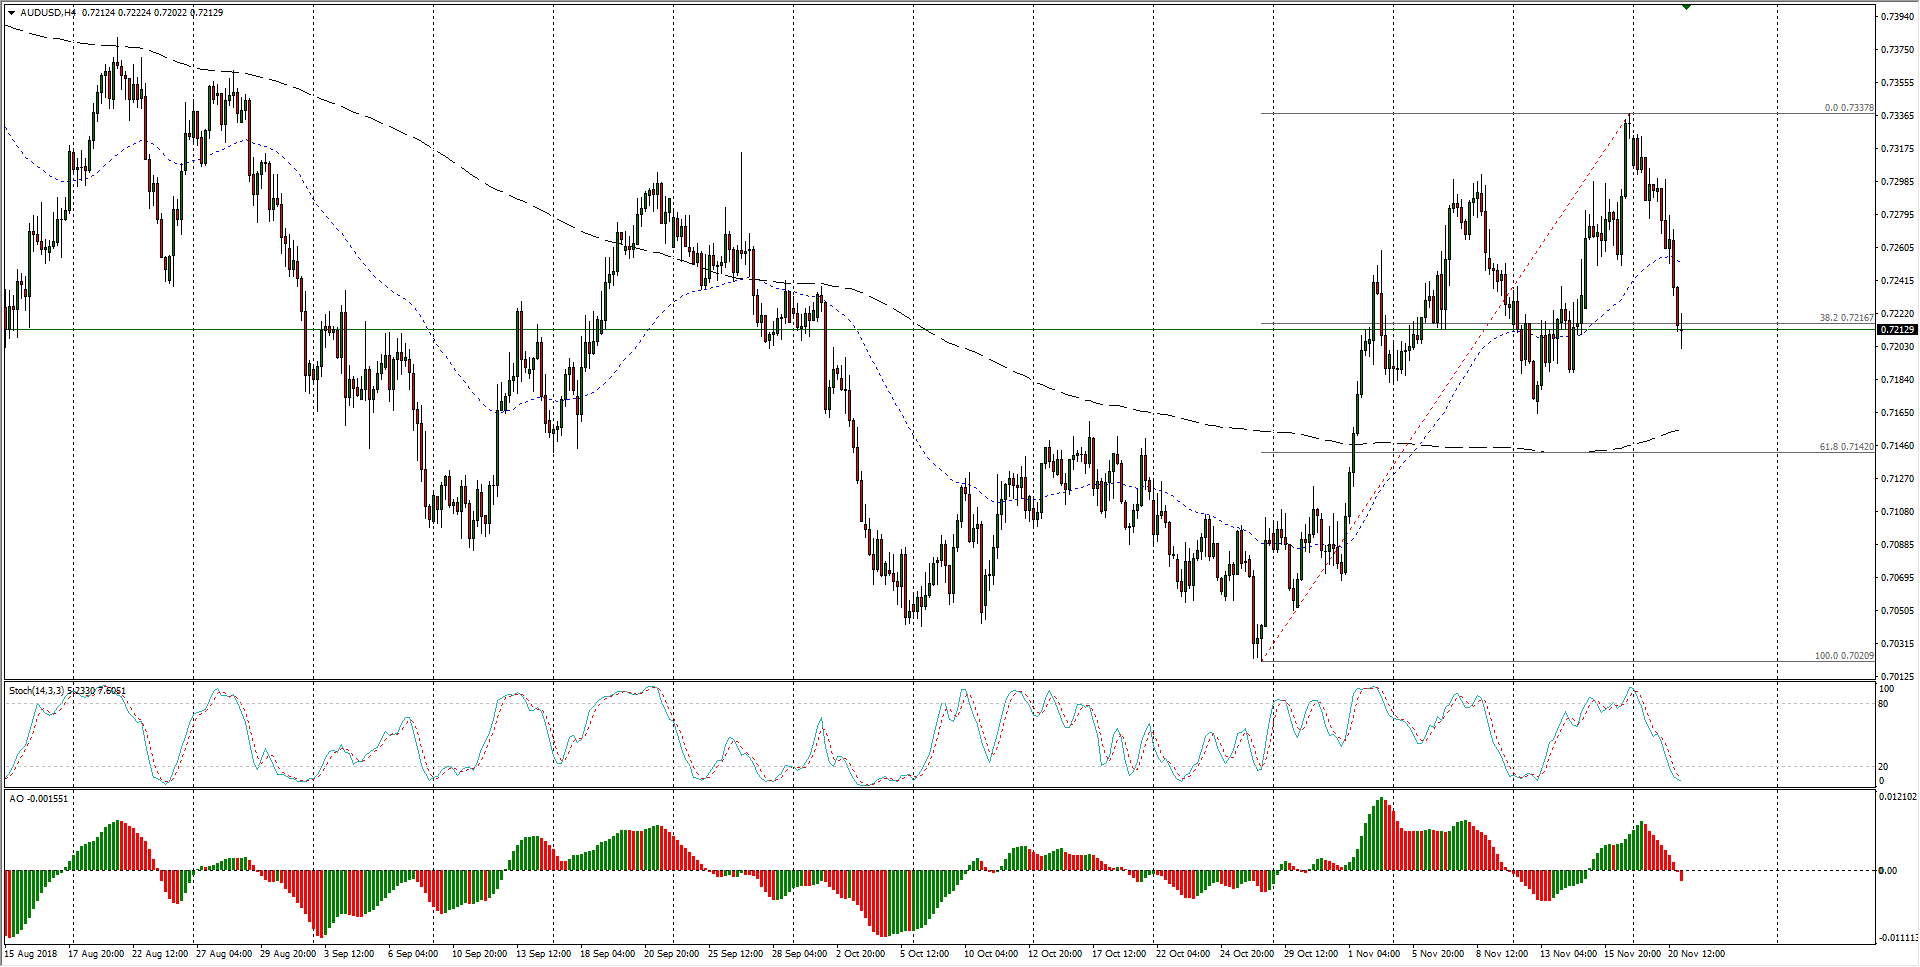
- The Aussie has seen rough cyclical action over the past quarter, and while the AUD/USD is currently hung up on a key confluence of the 38.2 Fibo retracement level at the 0.7200 technical barrier, a bearish break is set to see the pair continue sliding into the 200-period moving average at the familiar 0.7150 zone.
AUD/USD Chart, 4-Hour
AUD/USD
Overview:
Last Price: 0.722
Daily change: 0.0 pips
Daily change: 1.42e-14%
Daily Open: 0.722
Trends:
Daily SMA20: 0.7191
Daily SMA50: 0.7173
Daily SMA100: 0.7255
Daily SMA200: 0.7448
Levels:
Daily High: 0.7302
Daily Low: 0.7212
Weekly High: 0.7336
Weekly Low: 0.7164
Monthly High: 0.724
Monthly Low: 0.702
Daily Fibonacci 38.2%: 0.7246
Daily Fibonacci 61.8%: 0.7268
Daily Pivot Point S1: 0.7187
Daily Pivot Point S2: 0.7154
Daily Pivot Point S3: 0.7097
Daily Pivot Point R1: 0.7278
Daily Pivot Point R2: 0.7335
Daily Pivot Point R3: 0.7368
