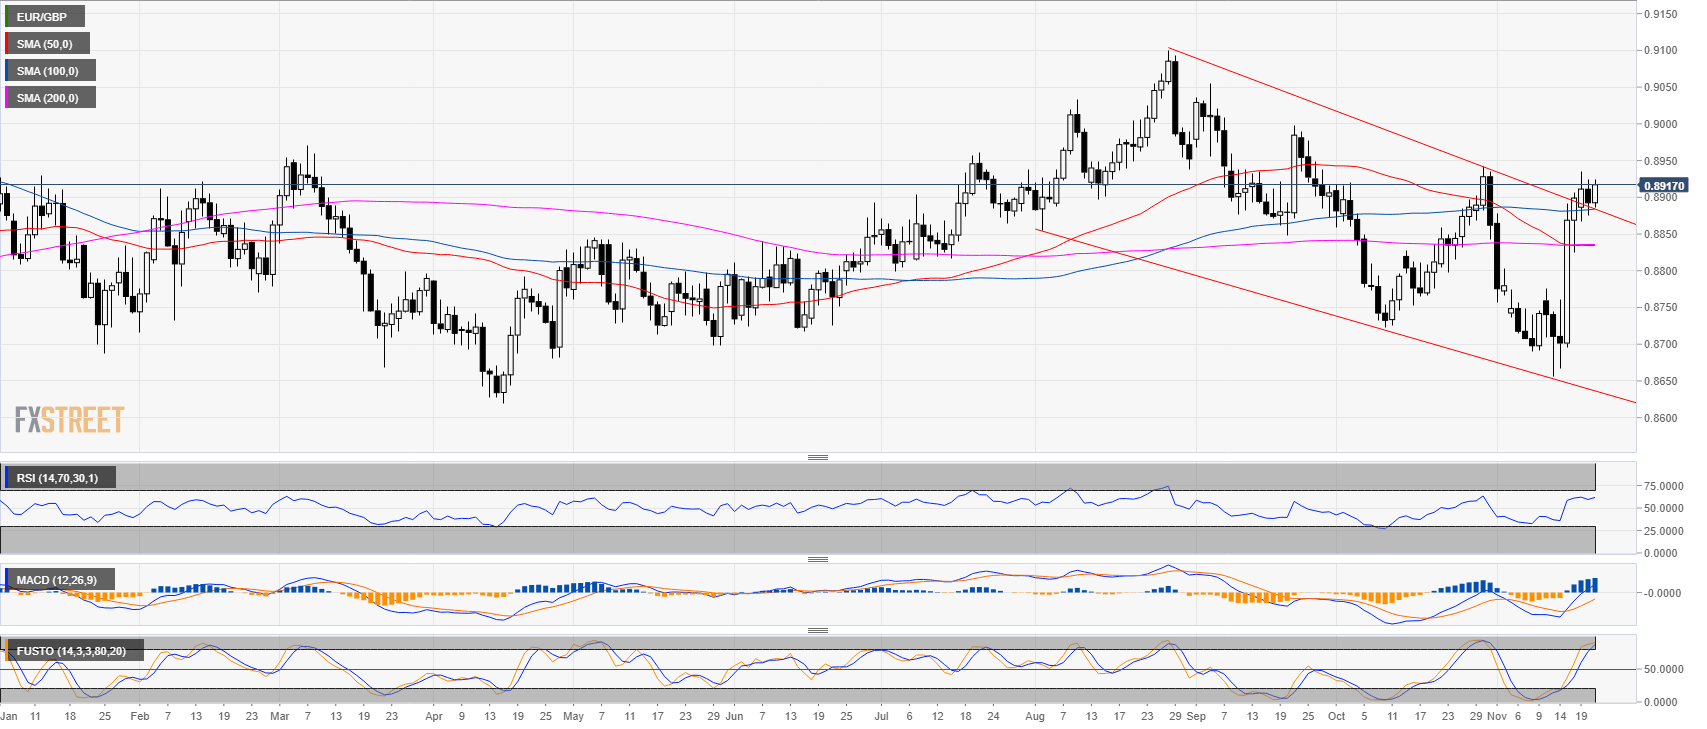
EUR/GBP daily chart
- EUR/GBP is trading above its 50, 100 and 200-day simple moving averages (SMA).
- EUR/GBP has been stuck near the 0.8900 figure for the third consecutive session.
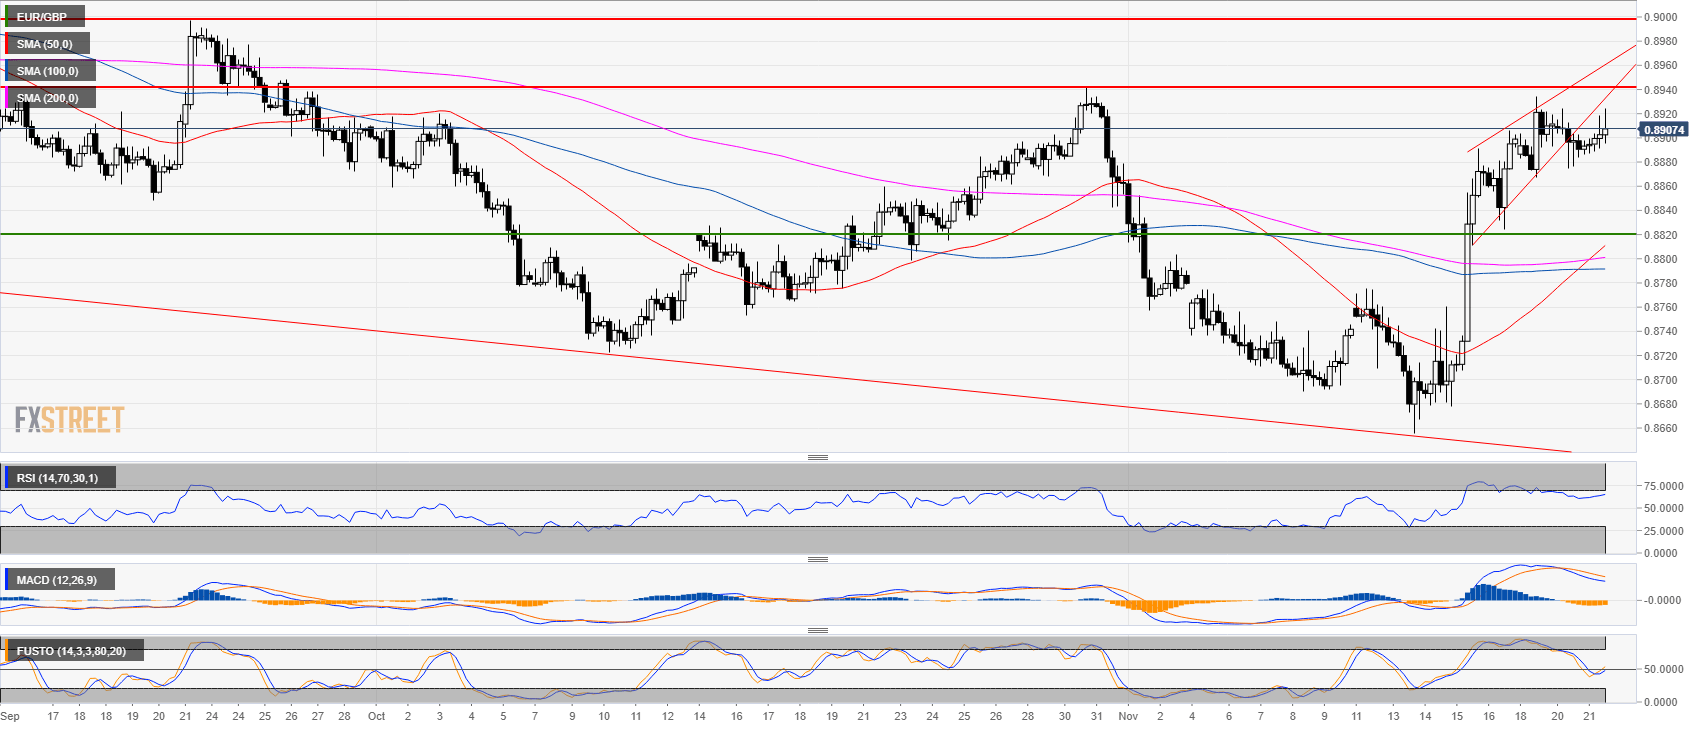
EUR/GBP 4-hour chart
- The rising wedge has tested the October high. The RSI, MACD and Stochastic are decelerating.
- EUR/GBP bulls seem to be running out of ammunitions setting up the stage for a sideways to down market.
- Failure to break above 0.8941 can lead to a deeper pullback to 0.8820. On the flip side, bulls objective is to reach 0.8941 (October high) followed by 0.8997 (Sept. 21 high).
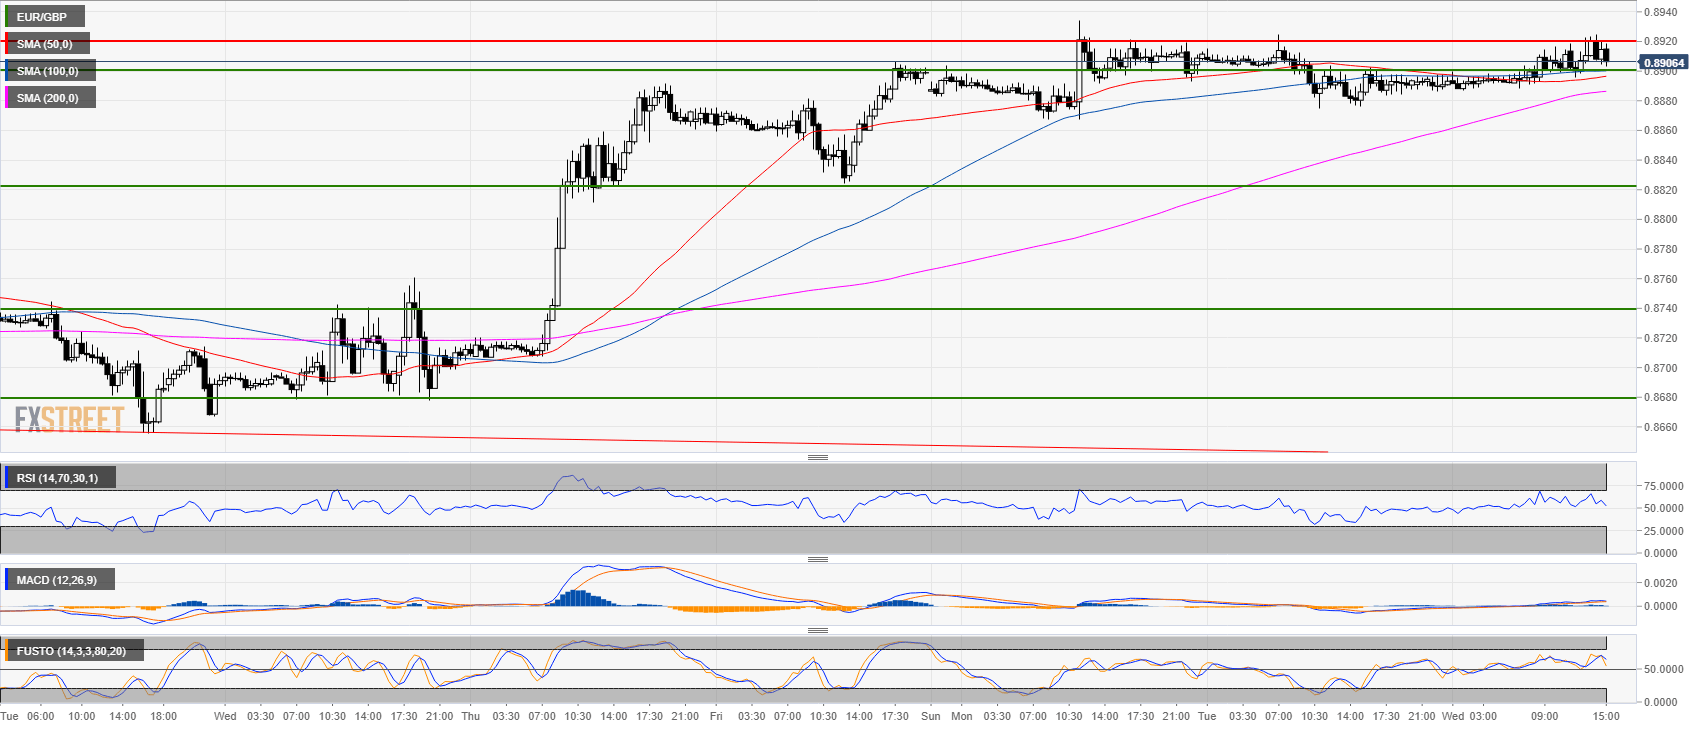
EUR/GBP 30-minute chart
- EUR/GBP is having a choppy session this Wednesday.
- 0.8920 is the resistance to beat for bulls while bears will want to close the day below 0.8900 figure.
Additional key levels at a glance
EUR/GBP
Overview:
Last Price: 0.8907
Daily change: 15 pips
Daily change: 0.169%
Daily Open: 0.8892
Trends:
Daily SMA20: 0.8809
Daily SMA50: 0.8834
Daily SMA100: 0.8883
Daily SMA200: 0.8836
Levels:
Daily High: 0.8924
Daily Low: 0.8875
Weekly High: 0.8906
Weekly Low: 0.8656
Monthly High: 0.8942
Monthly Low: 0.8722
Daily Fibonacci 38.2%: 0.8894
Daily Fibonacci 61.8%: 0.8906
Daily Pivot Point S1: 0.887
Daily Pivot Point S2: 0.8848
Daily Pivot Point S3: 0.8821
Daily Pivot Point R1: 0.892
Daily Pivot Point R2: 0.8947
Daily Pivot Point R3: 0.8969
