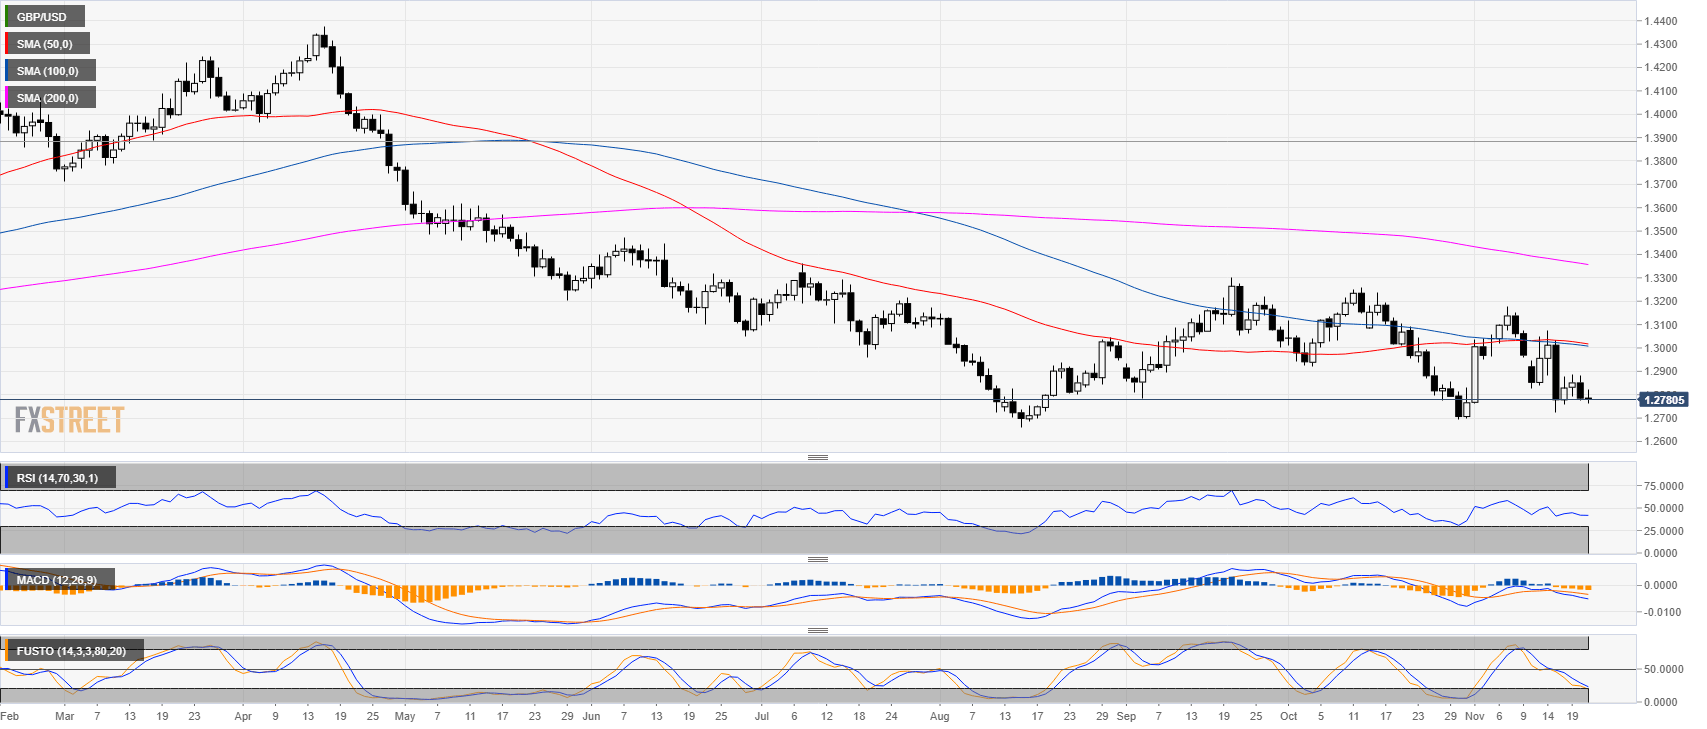
GBP/USD daily chart
- GBP/USD is trading in a bear trend below its main simple moving averages (SMAs).
- GBP/USD is trading near November lows as technical indicators are weak.
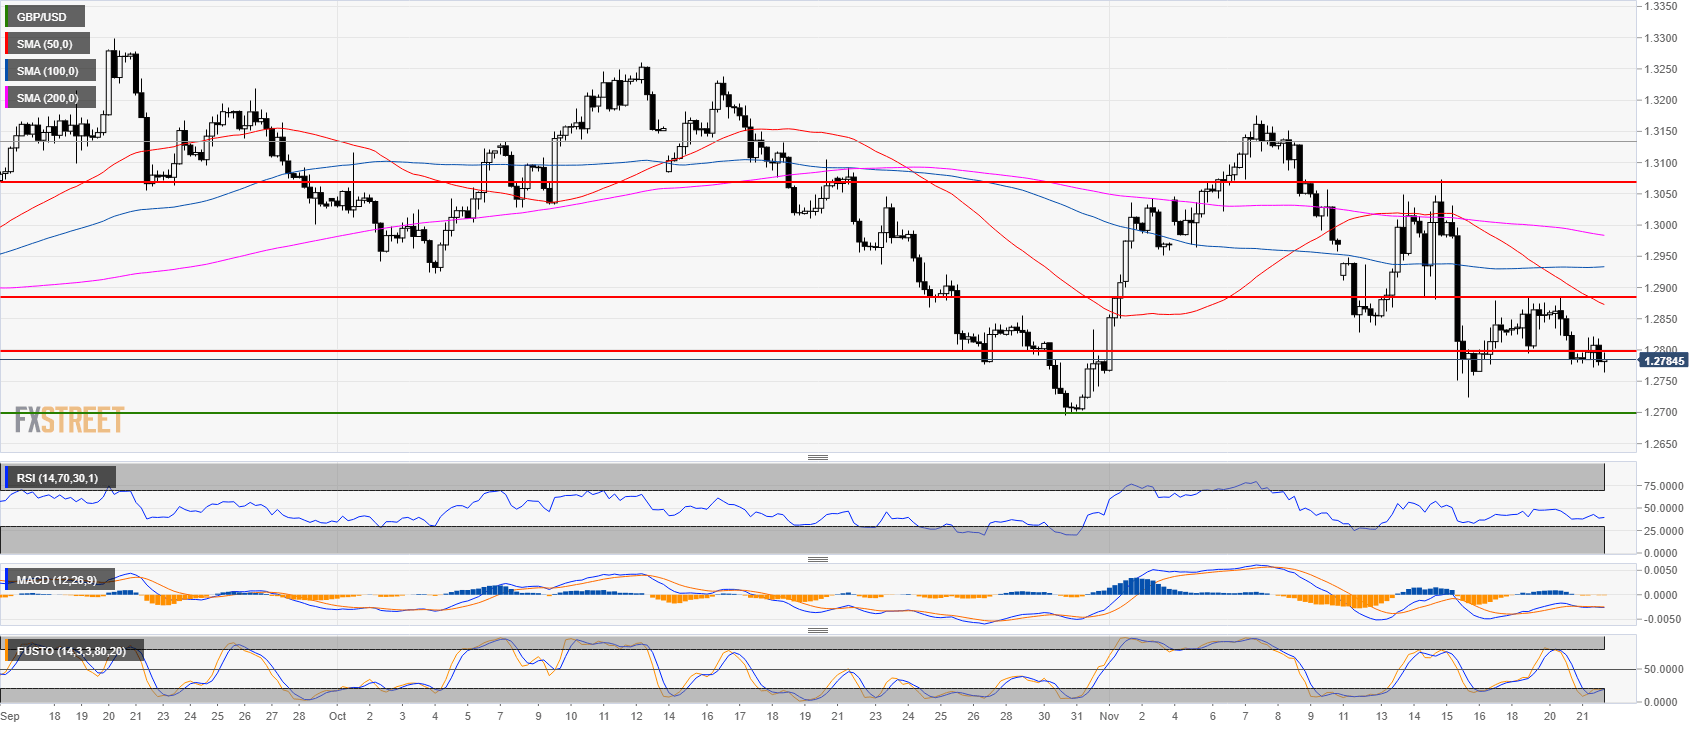
GBP/USD 4-hour chart
- The 1.2800 figure is acting as resistance.
- Technical indicators are weak.
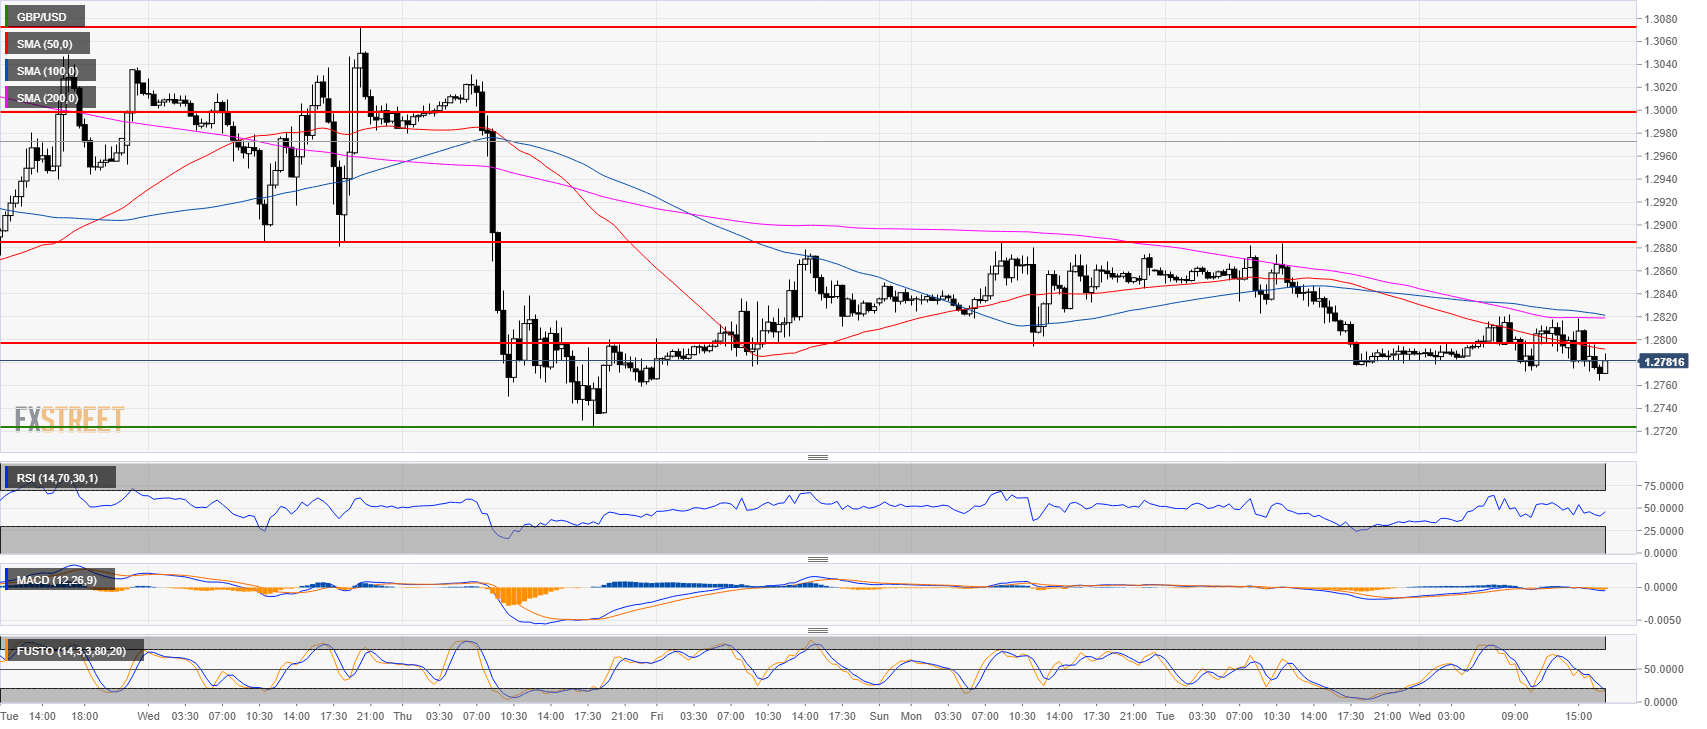
GBP/USD 30-minute chart
- GBP/USD has been moving slowly in the last three sessions.
- GBP/USD is below its main SMAs while technical indicators are bearish.
- The next target is likely the 1.2720 level. A break above 1.2880 might invalidate the current bearish pressure.
Additional key levels at a glance:
GBP/USD
Overview:
Last Price: 1.2785
Daily change: 0.0 pips
Daily change: 0.00%
Daily Open: 1.2785
Trends:
Daily SMA20: 1.2907
Daily SMA50: 1.3023
Daily SMA100: 1.3012
Daily SMA200: 1.3364
Levels:
Daily High: 1.2884
Daily Low: 1.2776
Weekly High: 1.3074
Weekly Low: 1.2724
Monthly High: 1.326
Monthly Low: 1.2696
Daily Fibonacci 38.2%: 1.2817
Daily Fibonacci 61.8%: 1.2843
Daily Pivot Point S1: 1.2747
Daily Pivot Point S2: 1.2708
Daily Pivot Point S3: 1.2639
Daily Pivot Point R1: 1.2854
Daily Pivot Point R2: 1.2922
Daily Pivot Point R3: 1.2961
