- The GBP/USD is seeing a quick pickup for early Wednesday, but intraday resistance waits nearby at the 38.2% Fibo retracement level at 1.2817.
- GBP/USD Forecast: Risk skewed to the downside; focus on UK PM May-EU’s Juncker meeting
GBP/USD Chart, 5-Minute
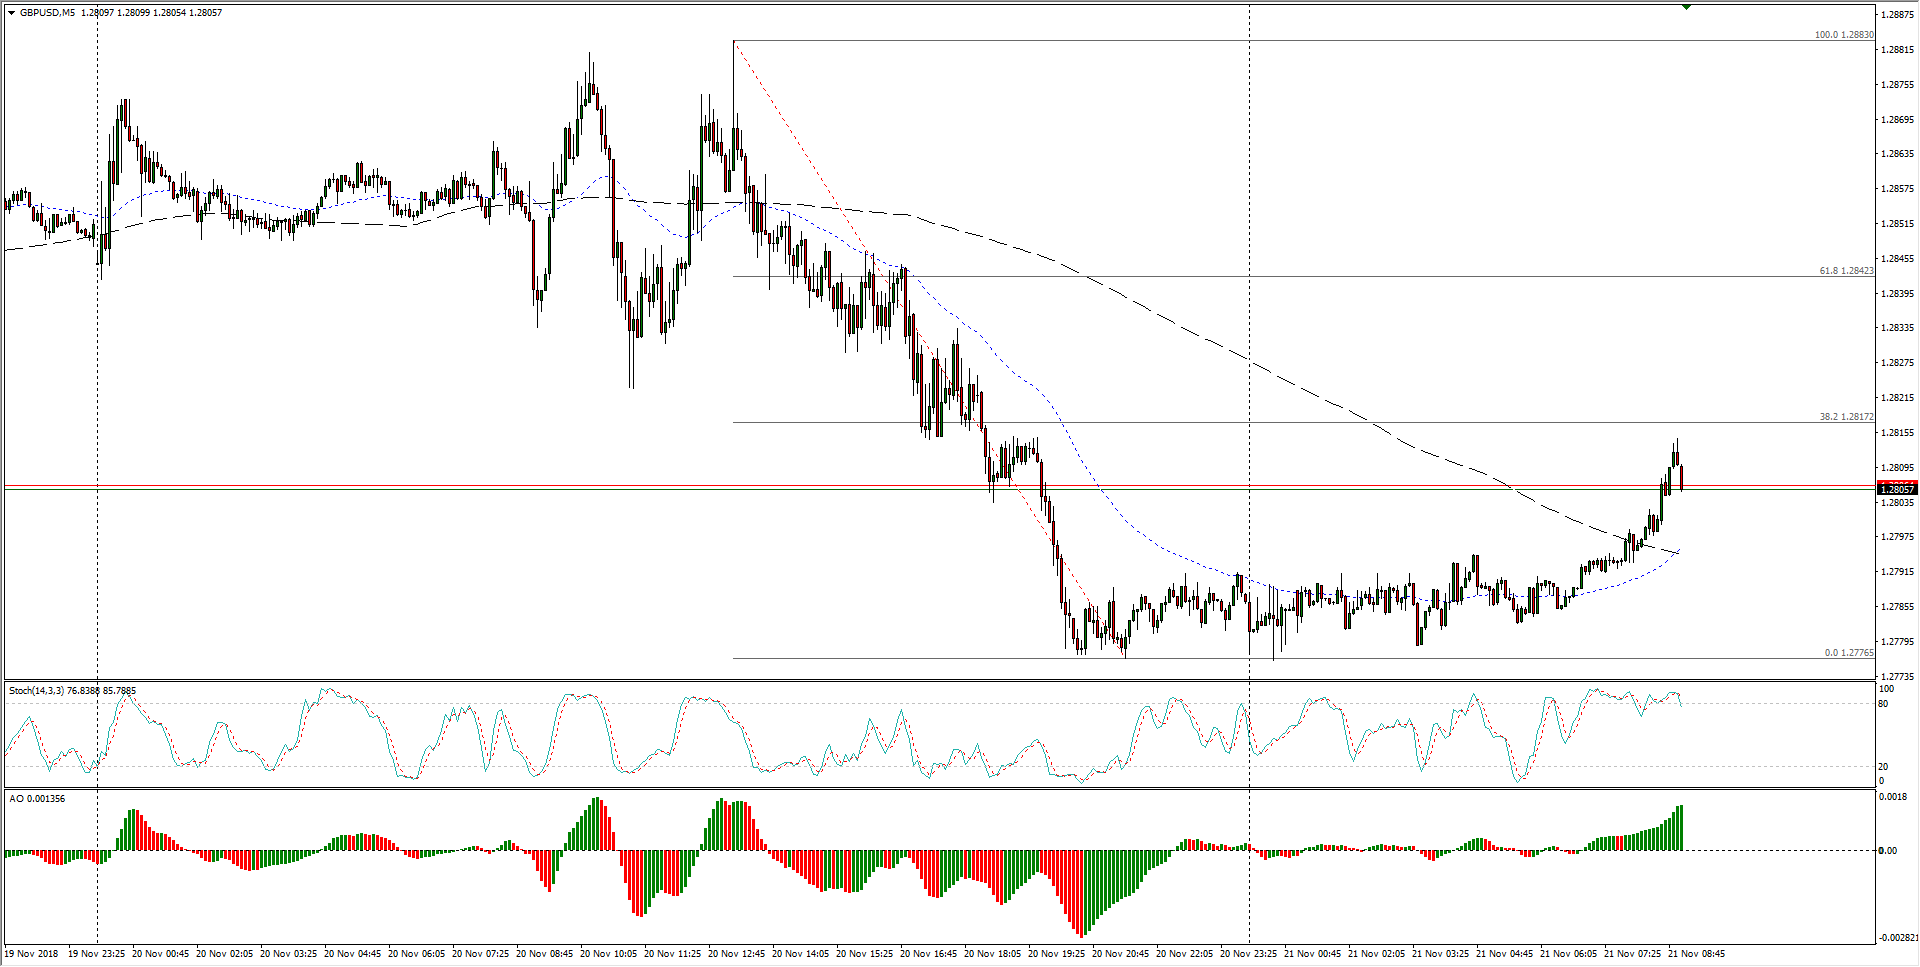
- The Sterling’s chart has become a hot mess over the past two weeks, though rough patches of buying continue to knock steadily lower over time.
GBP/USD Chart, 30-Minute
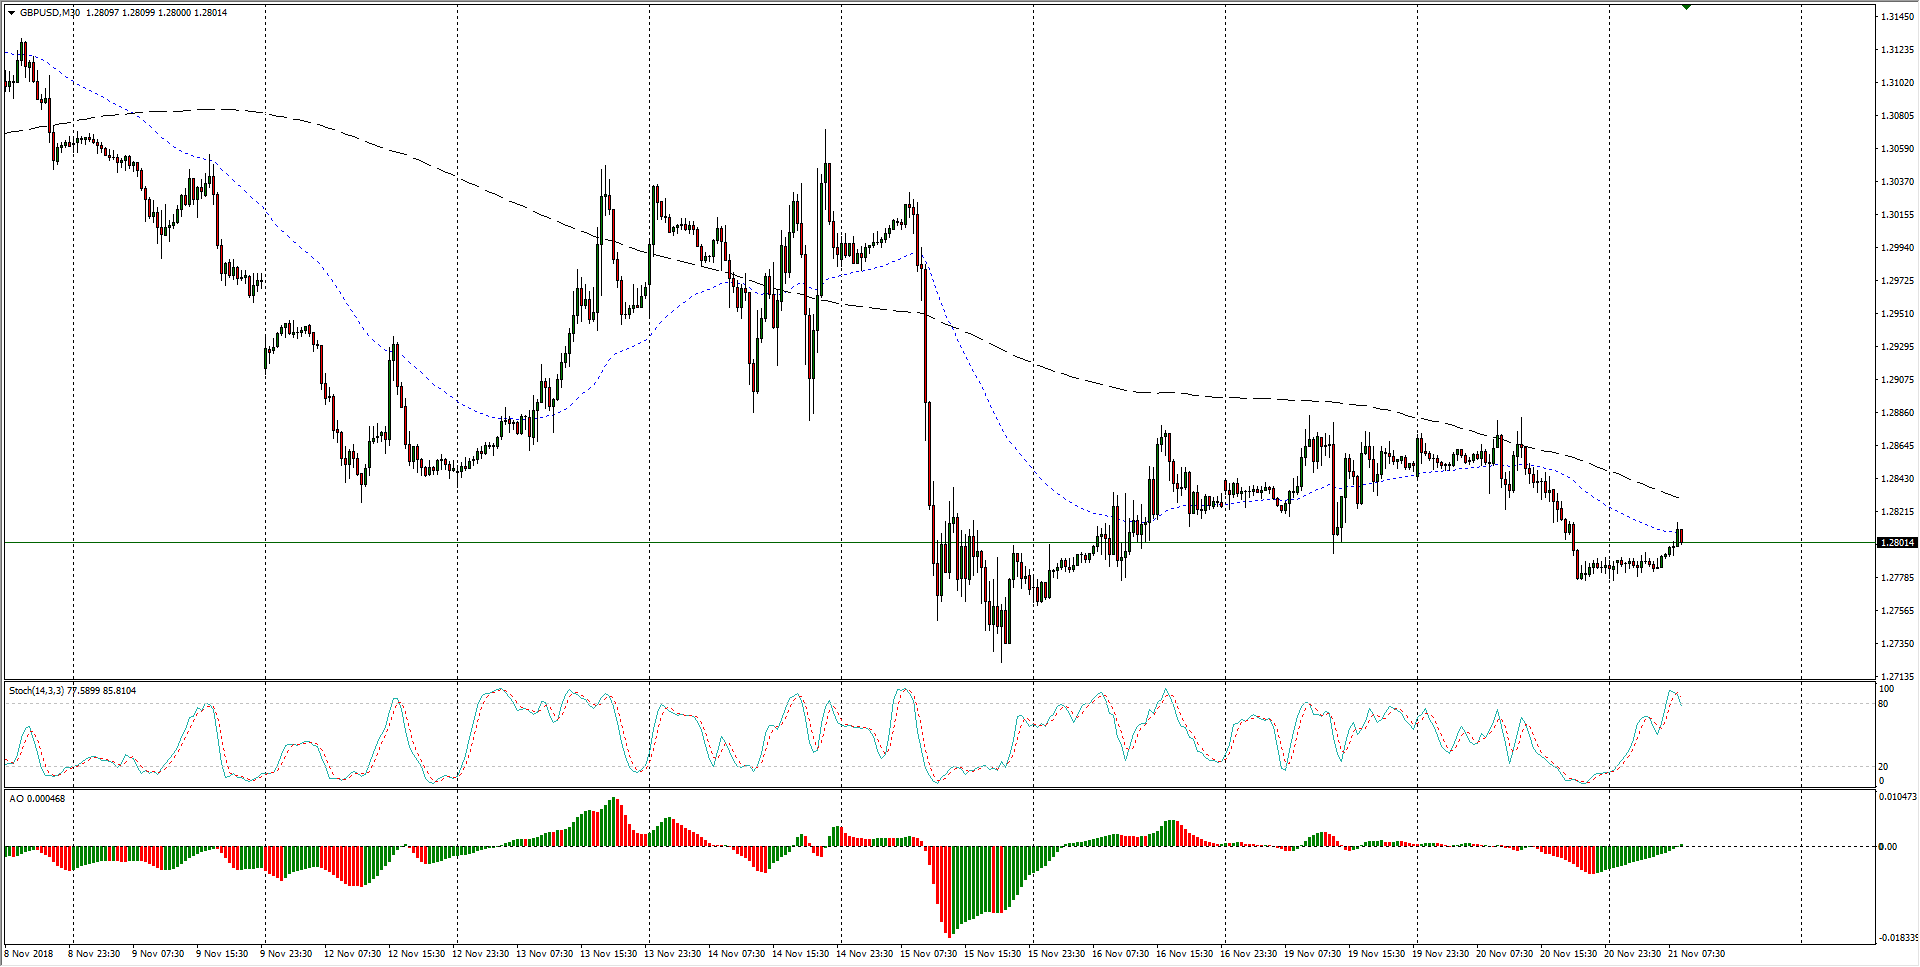
- The Cable finds itself strung out along the 1.2800 major handle once again, a familiar level as the GBP continues to spiral in medium-term congestion against the Greenback.
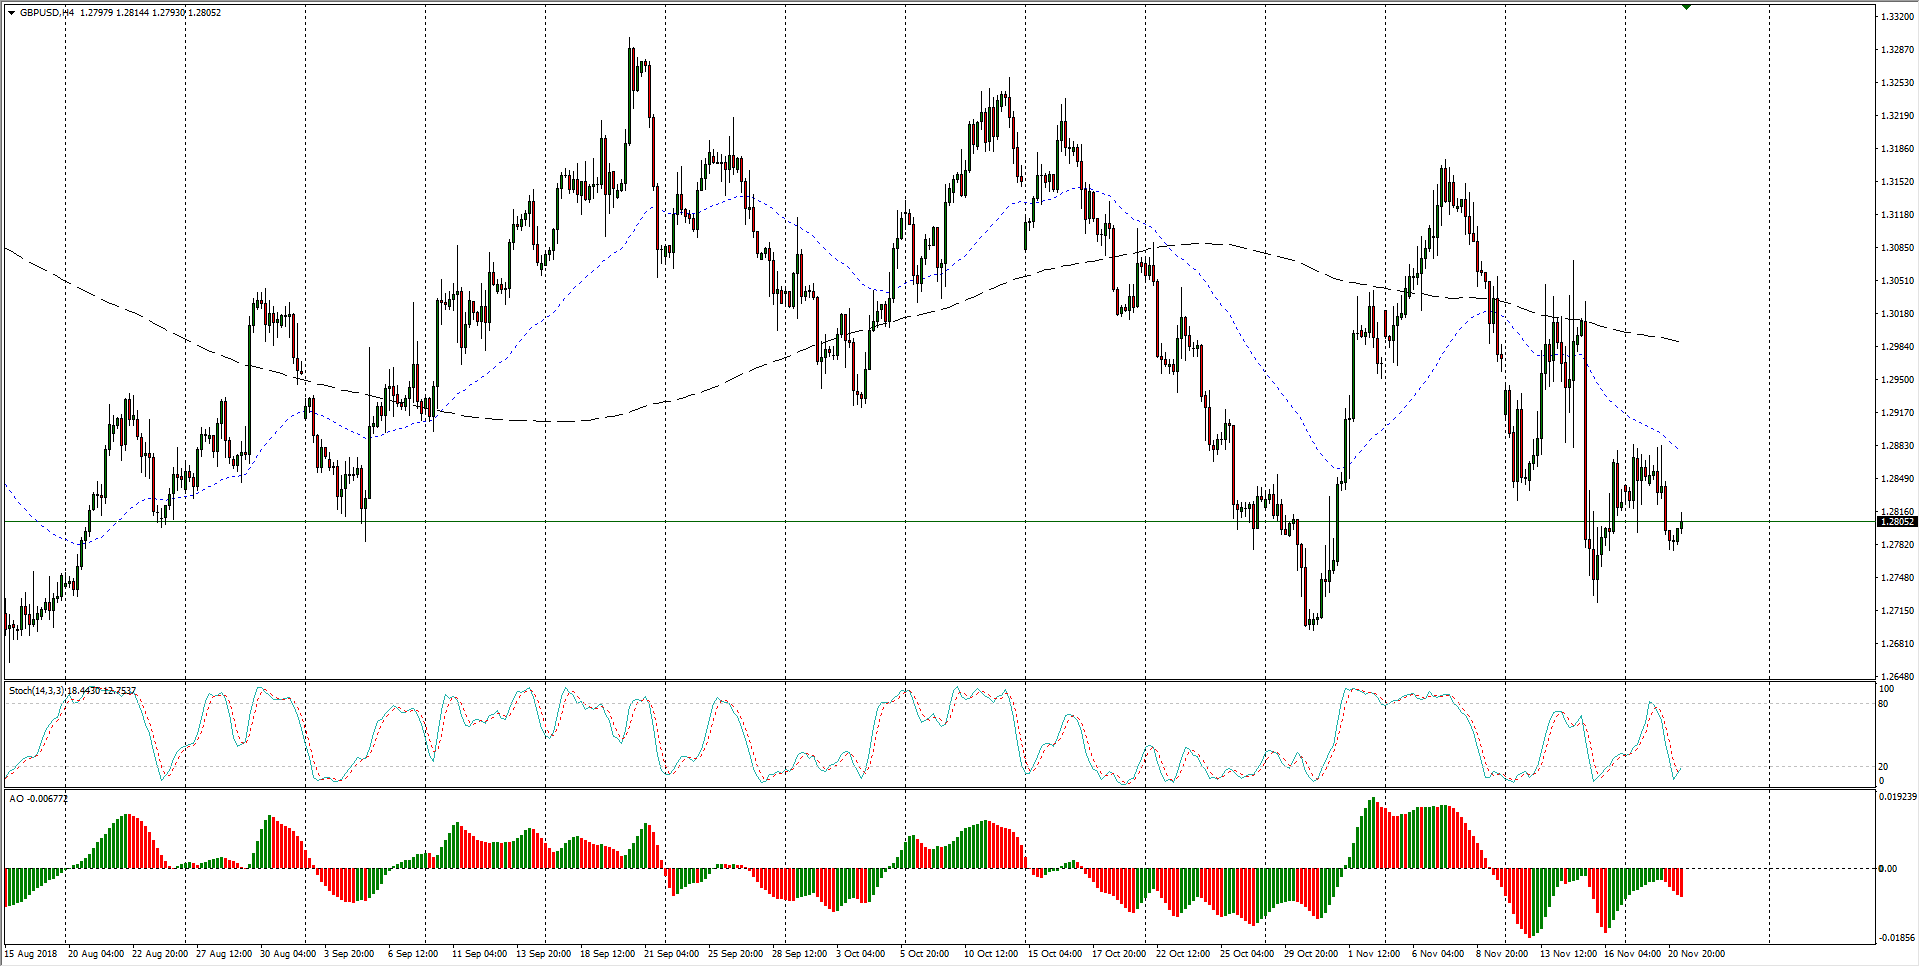
GBP/USD Chart, 4-Hour
GBP/USD
Overview:
Last Price: 1.2805
Daily change: 20 pips
Daily change: 0.156%
Daily Open: 1.2785
Trends:
Daily SMA20: 1.2907
Daily SMA50: 1.3023
Daily SMA100: 1.3012
Daily SMA200: 1.3364
Levels:
Daily High: 1.2884
Daily Low: 1.2776
Weekly High: 1.3074
Weekly Low: 1.2724
Monthly High: 1.326
Monthly Low: 1.2696
Daily Fibonacci 38.2%: 1.2817
Daily Fibonacci 61.8%: 1.2843
Daily Pivot Point S1: 1.2747
Daily Pivot Point S2: 1.2708
Daily Pivot Point S3: 1.2639
Daily Pivot Point R1: 1.2854
Daily Pivot Point R2: 1.2922
Daily Pivot Point R3: 1.2961
