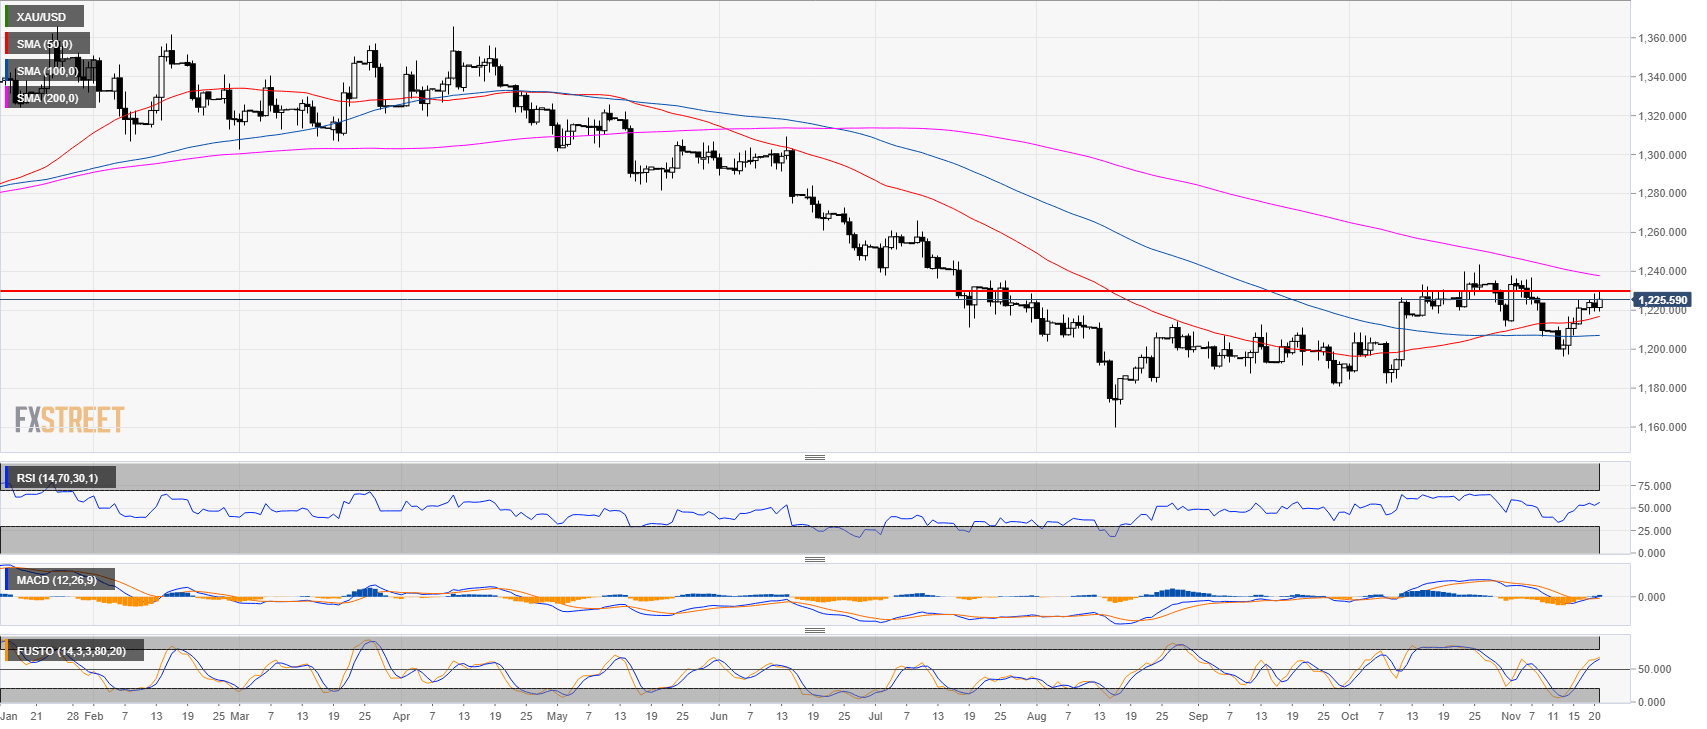
Daily chart
- Gold is trading in a bear trend below the 200-period simple moving average (SMAs).
- However, bulls managed to reclaim the 50 and 100 SMA with the 50 SMA crossing above the 100 SMA.
- The RSI and Stochastic indicators are both trading above the 50 line while the MACD is also turning bullish.
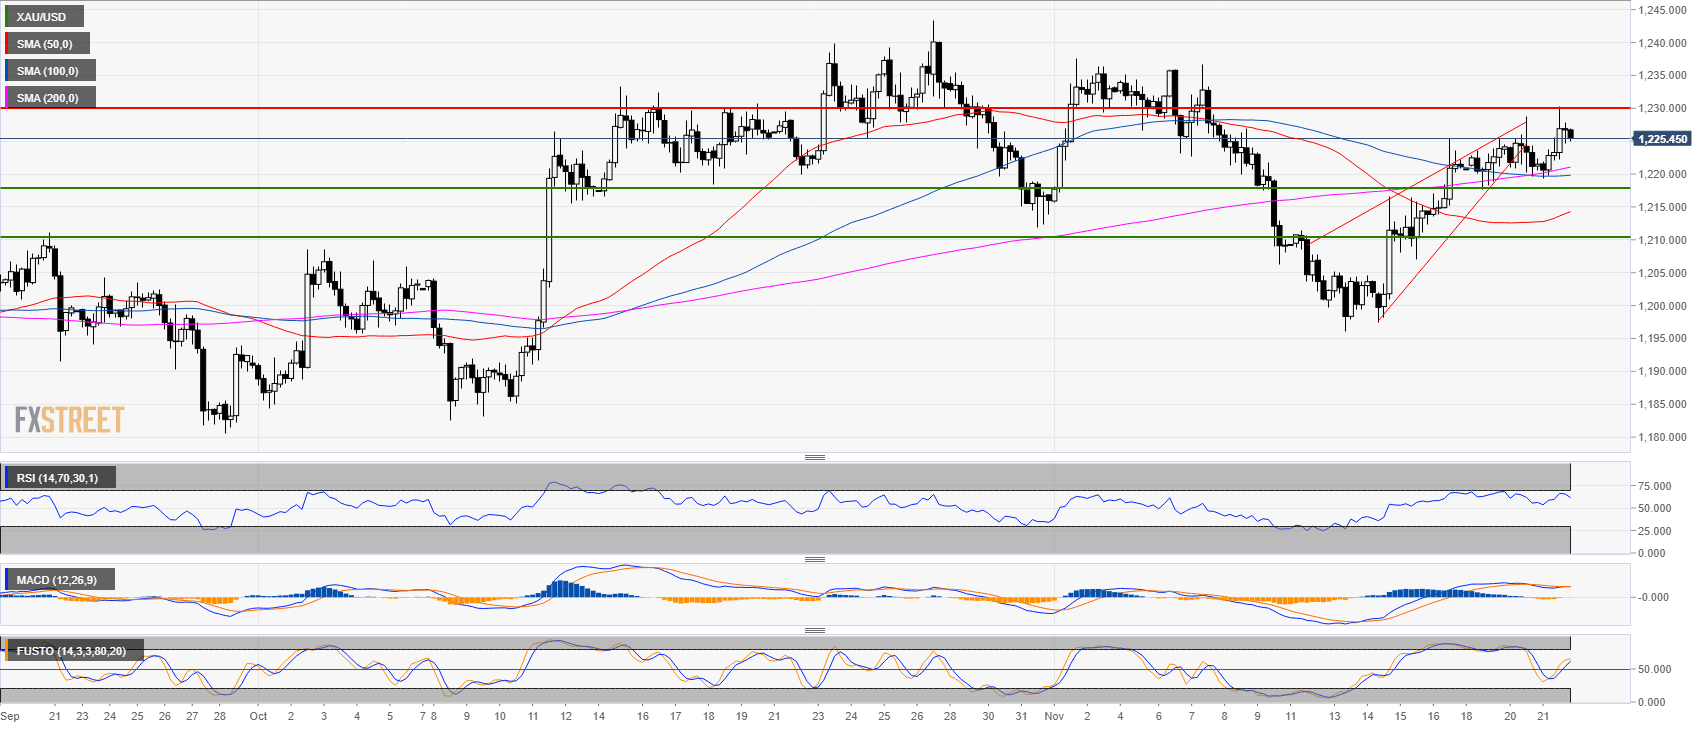
4-hour chart
- Gold found resistance at 1,230.00.
- Gold formed a wedge-shaped pattern followed by a double top.
- A pullback to 1,217.70 should be in the cards.
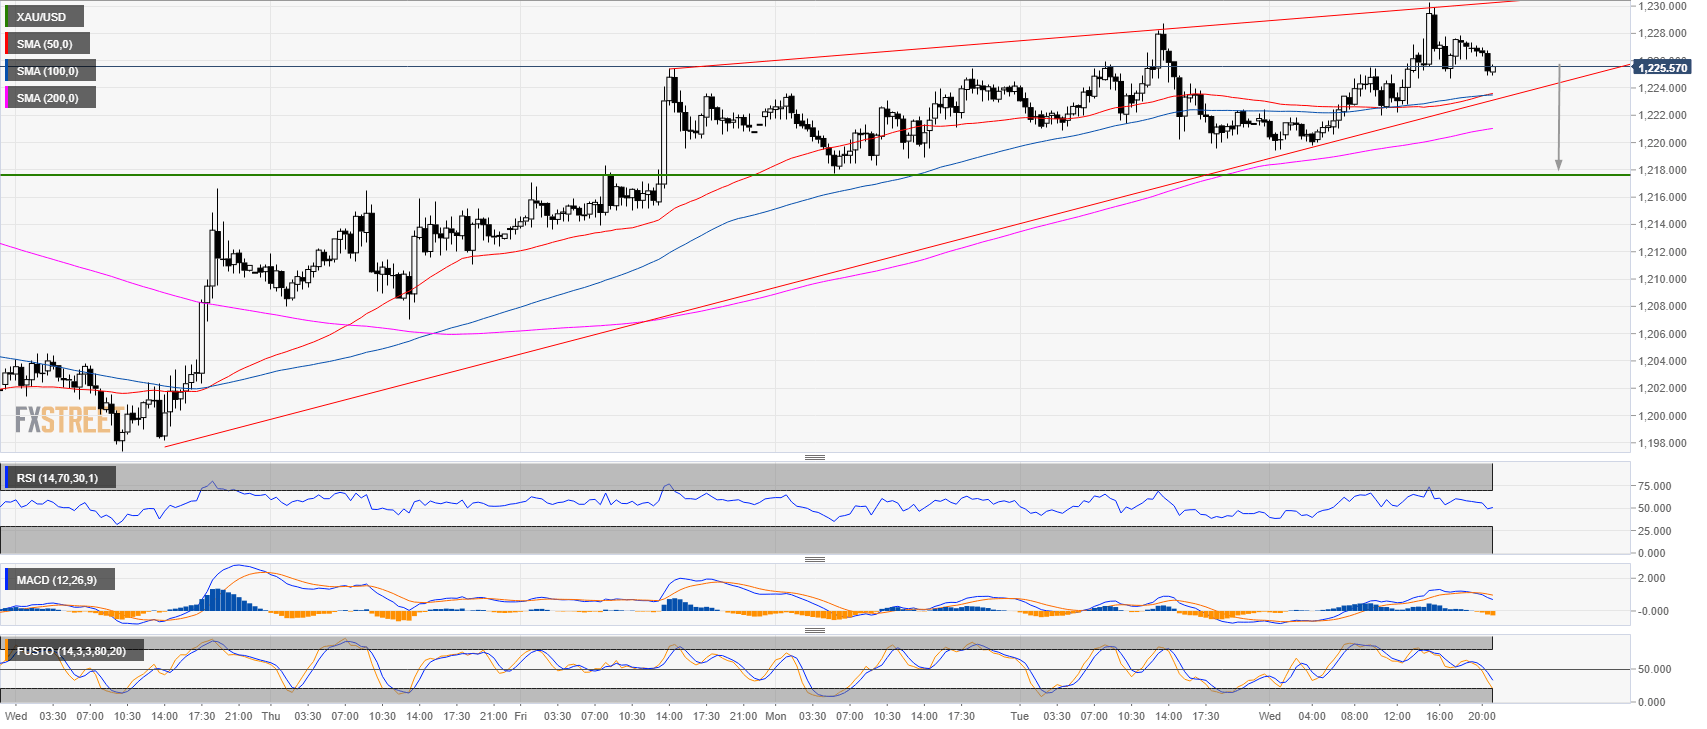
30-minute chart
- Technical indicators are decelerating.
Additional key levels at a glance:
XAU/USD
Overview:
Last Price: 1225.26
Daily change: 3.9e+2 pips
Daily change: 0.317%
Daily Open: 1221.39
Trends:
Daily SMA20: 1219.09
Daily SMA50: 1216.14
Daily SMA100: 1206.95
Daily SMA200: 1238.12
Levels:
Daily High: 1228.74
Daily Low: 1219.6
Weekly High: 1225.4
Weekly Low: 1196
Monthly High: 1243.43
Monthly Low: 1182.54
Daily Fibonacci 38.2%: 1223.09
Daily Fibonacci 61.8%: 1225.25
Daily Pivot Point S1: 1217.75
Daily Pivot Point S2: 1214.1
Daily Pivot Point S3: 1208.61
Daily Pivot Point R1: 1226.89
Daily Pivot Point R2: 1232.38
Daily Pivot Point R3: 1236.03
