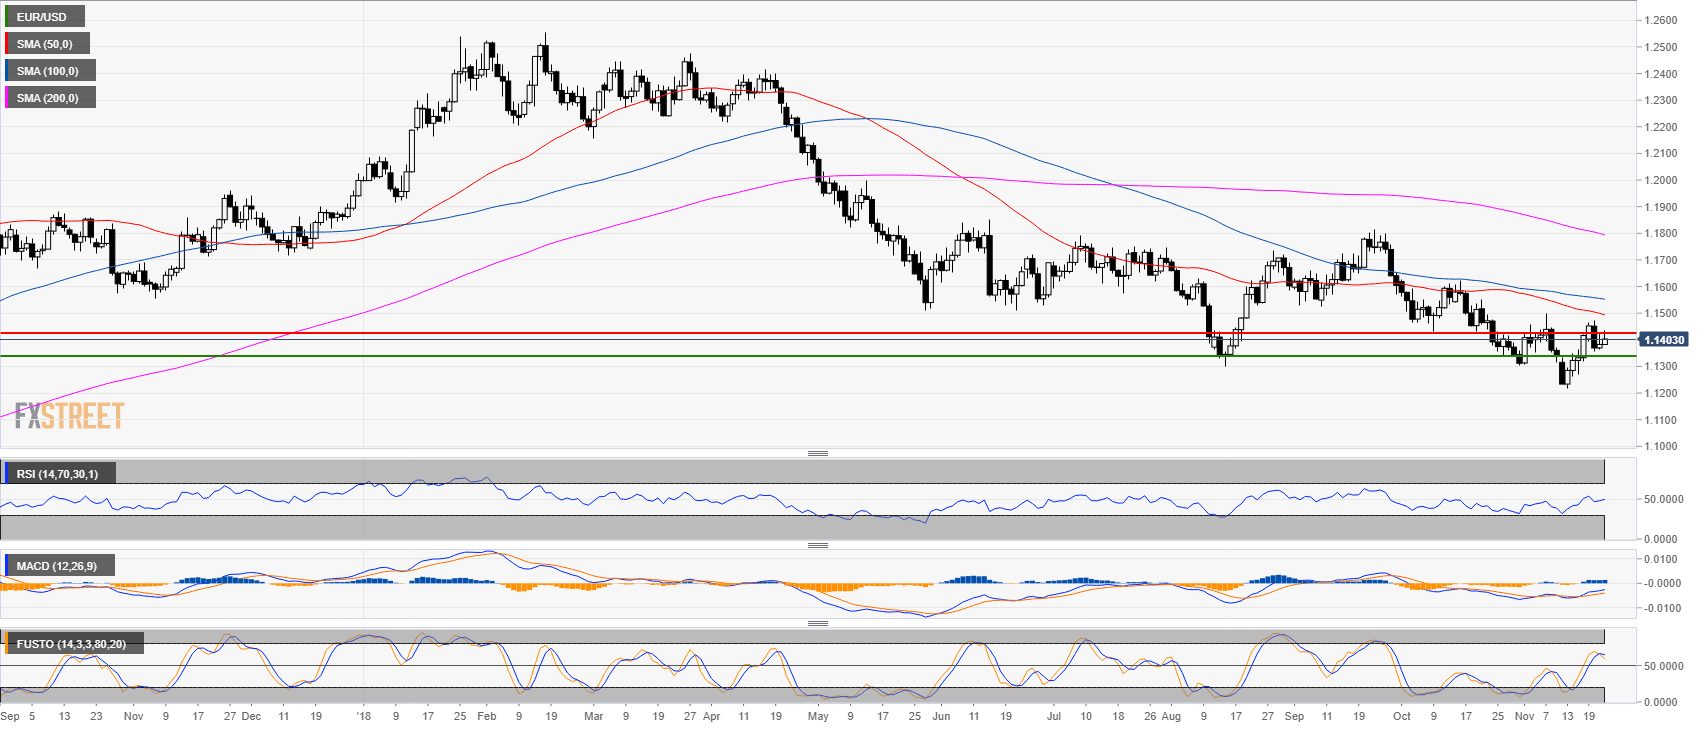
EUR/USD daily chart
- EUR/USD is trading below its main simple moving averages (SMAs) on the daily chart.
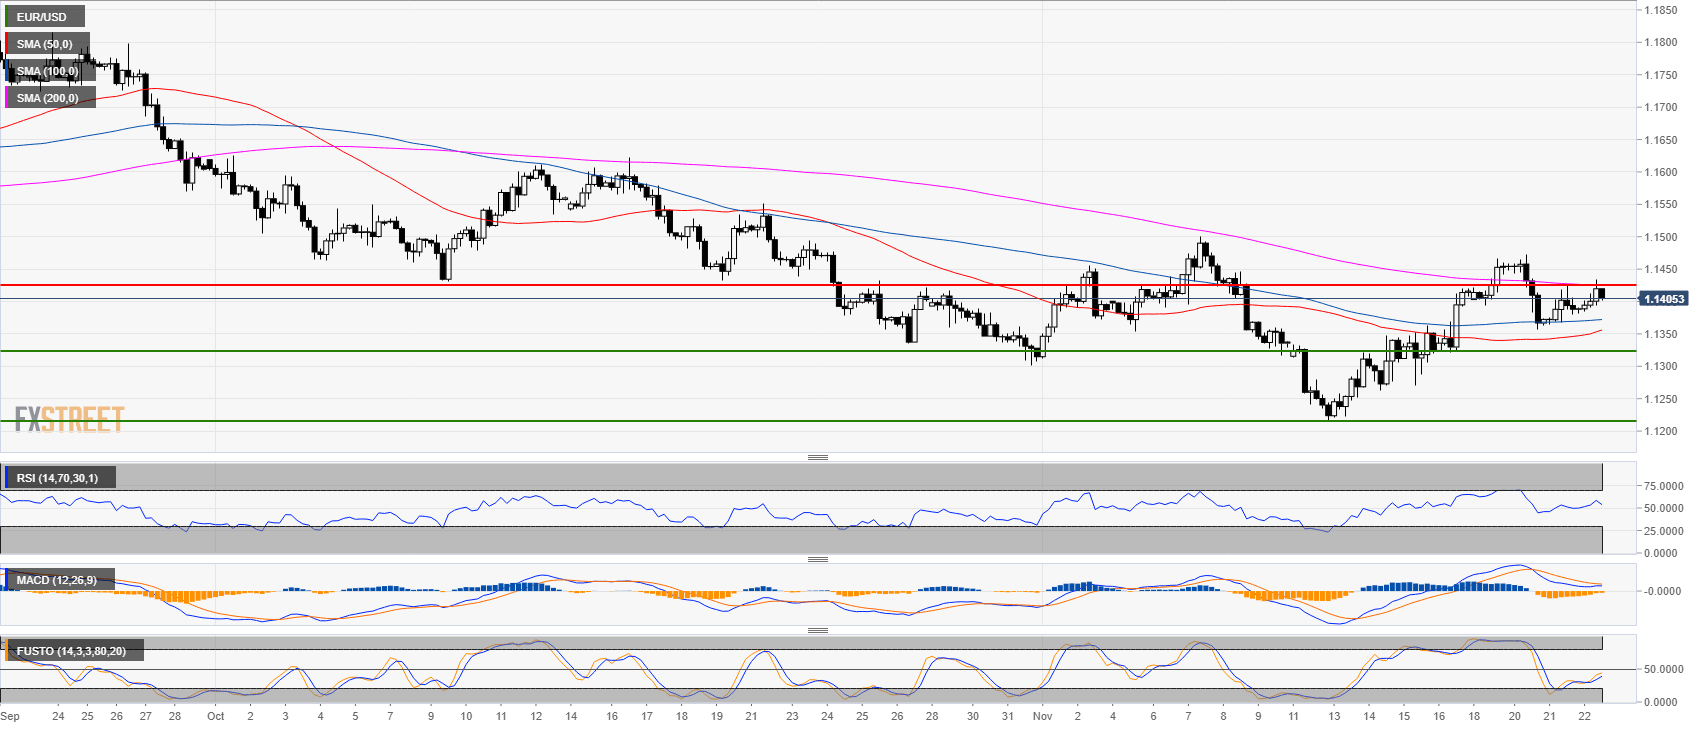
EUR/USD 4-hour chart
- EUR/USD is trading in a bear trend below the 200-period simple moving average on the 4-hour chart.
- EUR/USD attempted to break above 1.1430 but the market sharply reversed down from the resistance, trapping bulls and bears in the process.
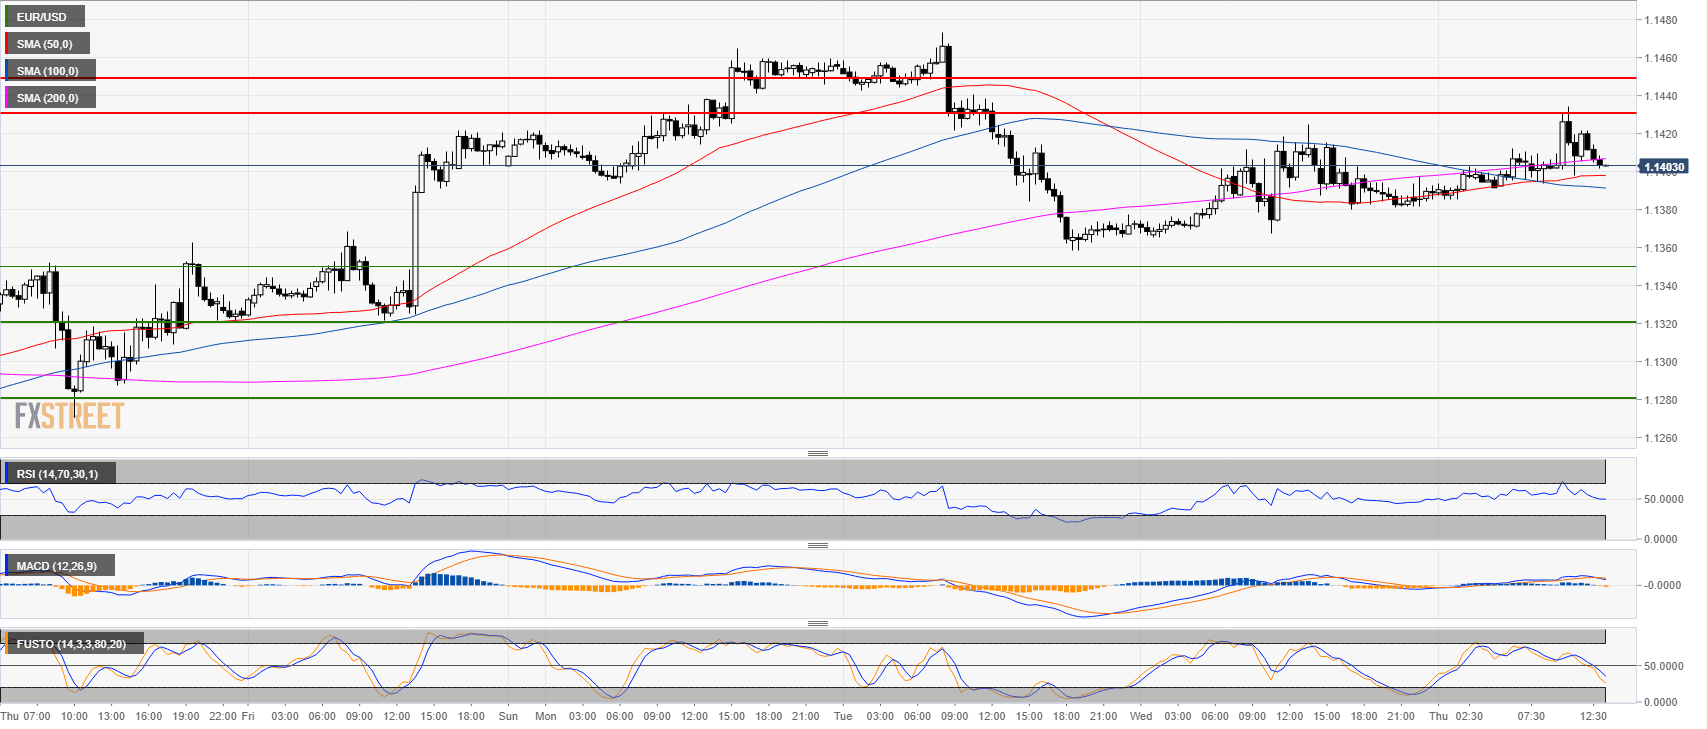
EUR/USD 30-minute chart
- EUR/USD created a double top with Wednesday and the current Thursday’s high.
- The price is struggling to hold above the 200 SMA as technical indicators are weakening.
- Targets to the downside are seen at 1.1350 and 1.1350 in the coming sessions. On the flip side 1.1430 and 1.1450 are strong resistances.
Additional key levels at a glance:
EUR/USD
Overview:
Last Price: 1.1403
Daily change: 20 pips
Daily change: 0.176%
Daily Open: 1.1383
Trends:
Daily SMA20: 1.1368
Daily SMA50: 1.1499
Daily SMA100: 1.1555
Daily SMA200: 1.1802
Levels:
Daily High: 1.1426
Daily Low: 1.1364
Weekly High: 1.142
Weekly Low: 1.1216
Monthly High: 1.1625
Monthly Low: 1.1302
Daily Fibonacci 38.2%: 1.1402
Daily Fibonacci 61.8%: 1.1387
Daily Pivot Point S1: 1.1356
Daily Pivot Point S2: 1.1329
Daily Pivot Point S3: 1.1294
Daily Pivot Point R1: 1.1418
Daily Pivot Point R2: 1.1453
Daily Pivot Point R3: 1.148
