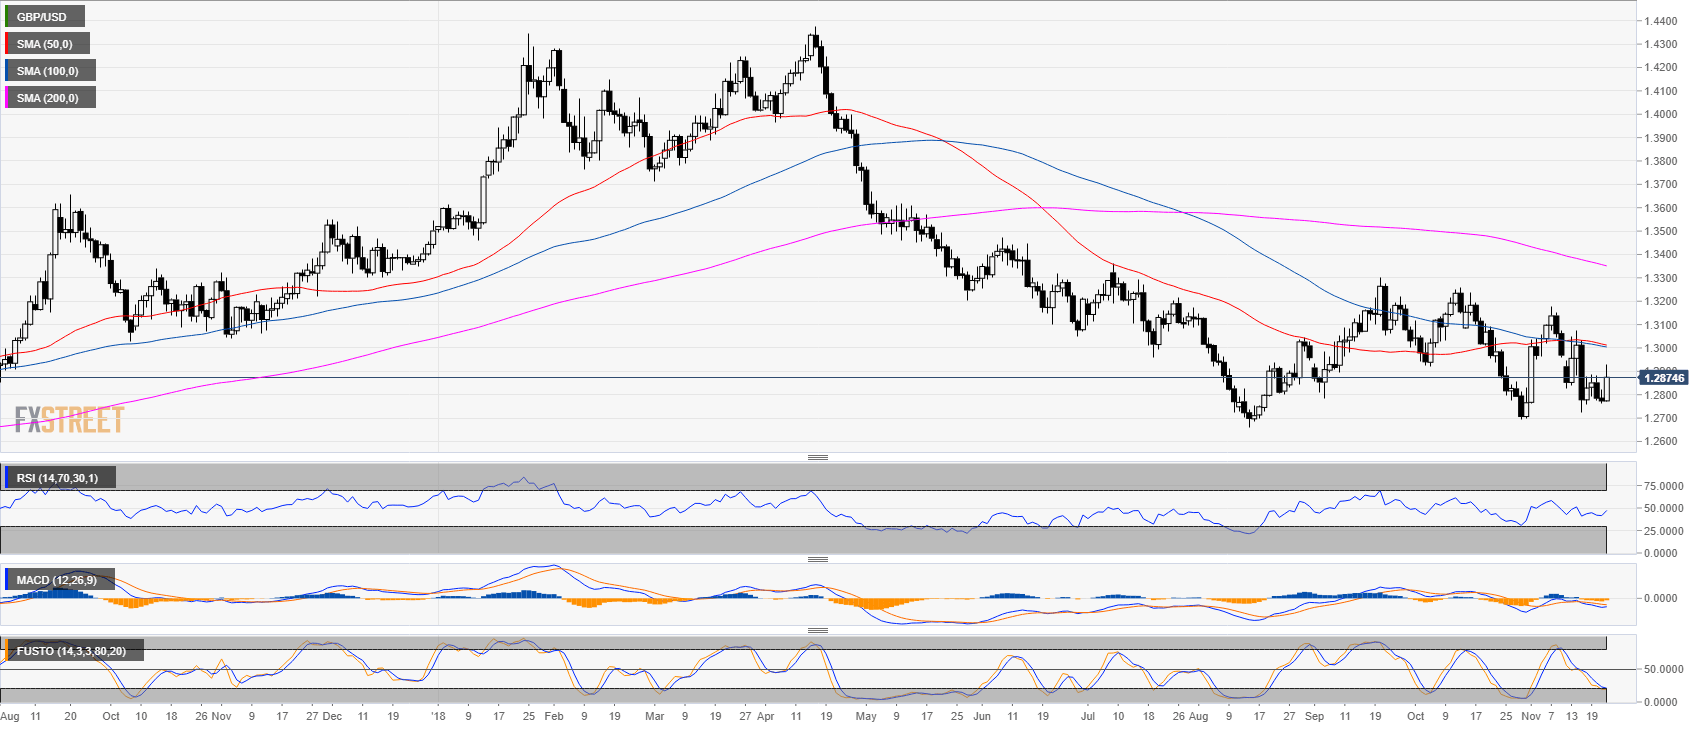
GBP/USD daily chart
- GBP/USD is trading in a bear trend below its main simple moving averages (SMAs).
- GBP/USD is trading near the November lows as technical indicators are weak.
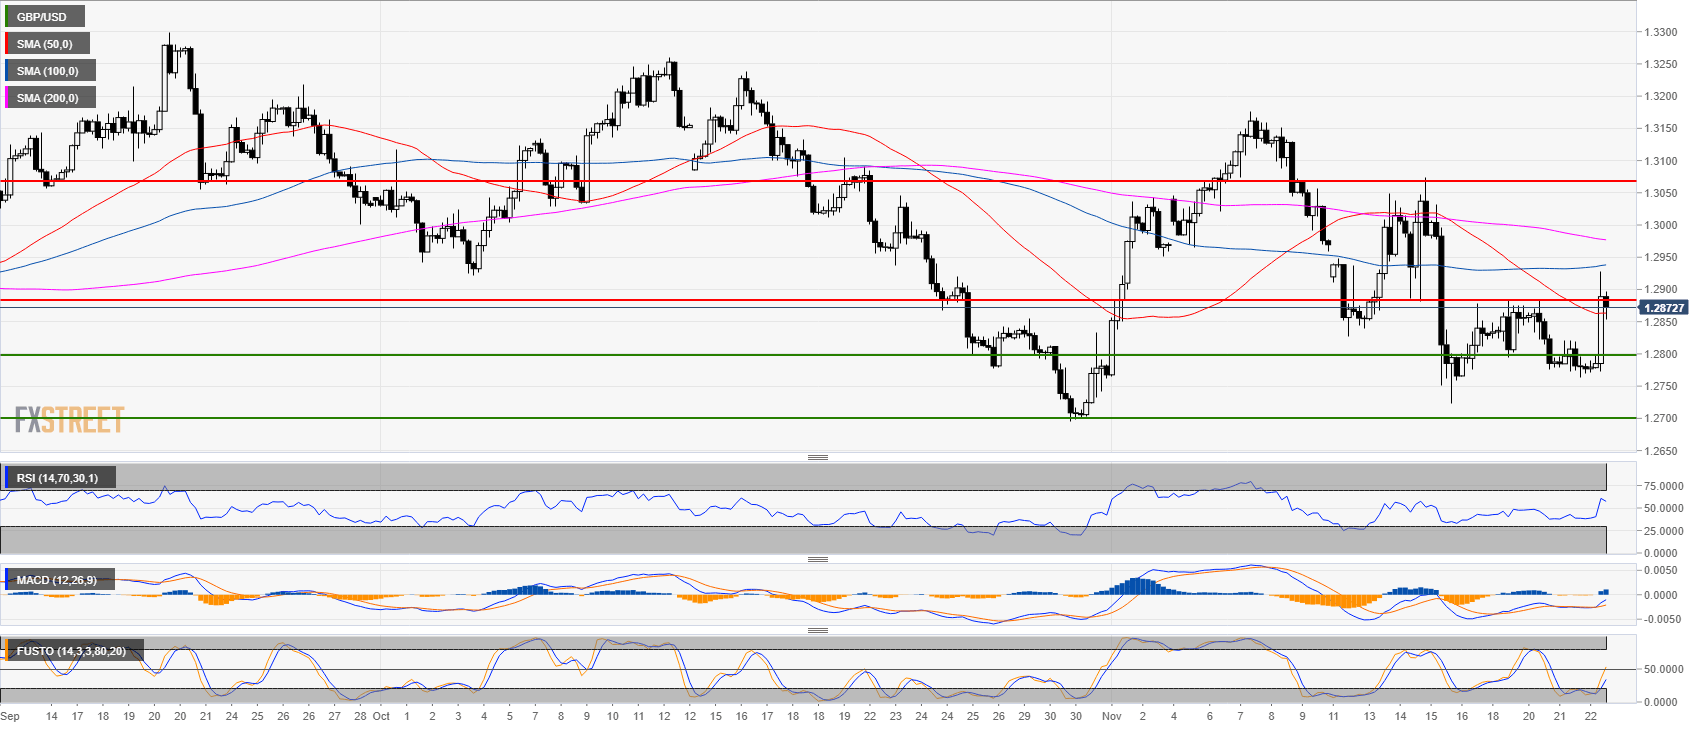
GBP/USD 4-hour chart
- GBP/USD found resistance near the 1.2880 level.
- GBP/USD is trading below its 200 SMA.
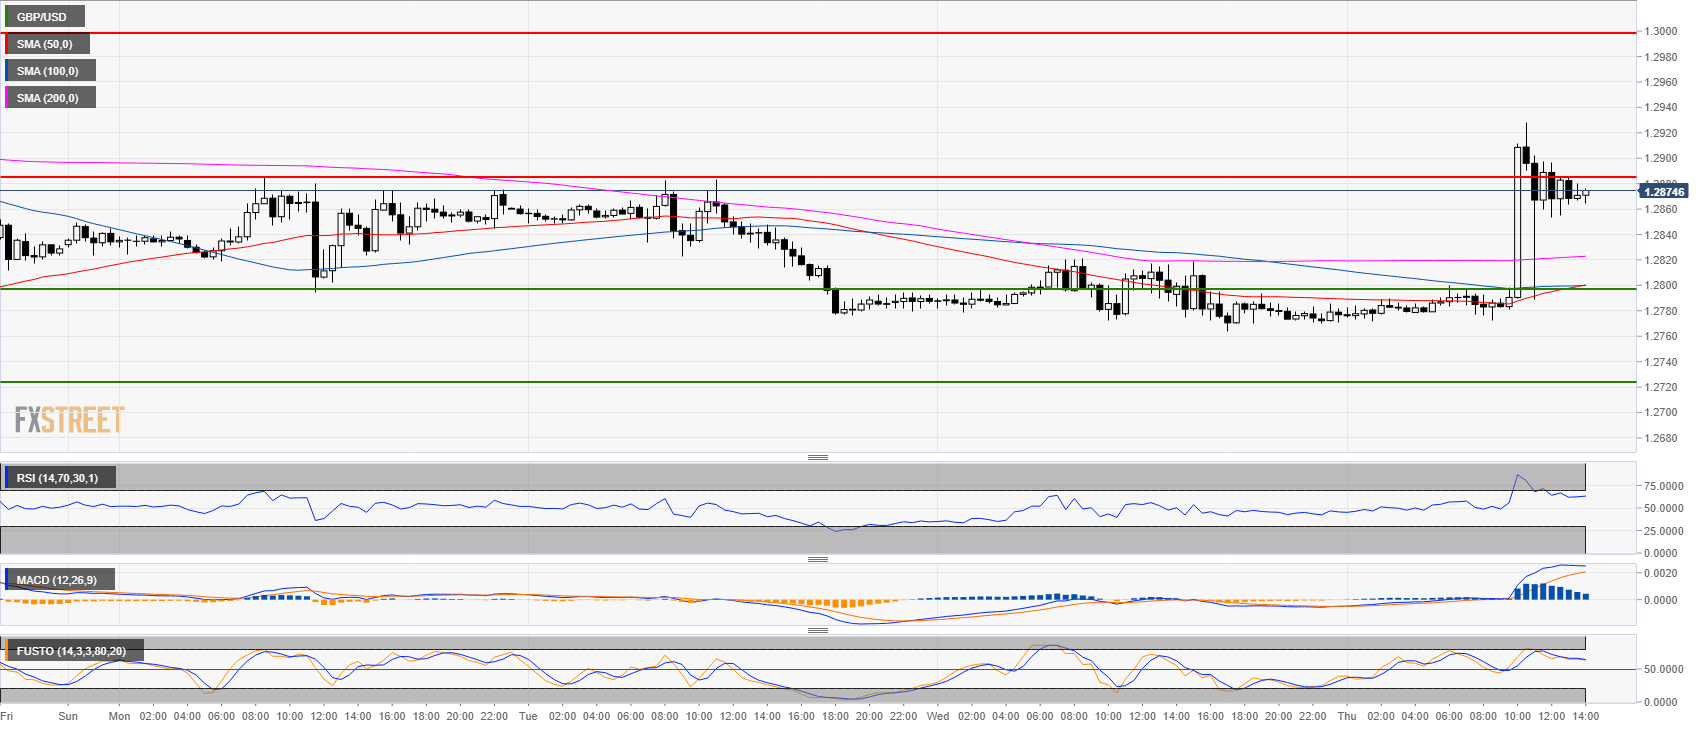
GBP/USD 30-minute chart
- The spike was lead by news and will likely be erased in the coming sessions.
- Targets to the downside are seen near 1.2800 figure and 1.2720 level.
Additional key levels
GBP/USD
Overview:
Last Price: 1.2871
Daily change: 98 pips
Daily change: 0.767%
Daily Open: 1.2773
Trends:
Daily SMA20: 1.2901
Daily SMA50: 1.3017
Daily SMA100: 1.3008
Daily SMA200: 1.3358
Levels:
Daily High: 1.2821
Daily Low: 1.2764
Weekly High: 1.3074
Weekly Low: 1.2724
Monthly High: 1.326
Monthly Low: 1.2696
Daily Fibonacci 38.2%: 1.2786
Daily Fibonacci 61.8%: 1.28
Daily Pivot Point S1: 1.2751
Daily Pivot Point S2: 1.2729
Daily Pivot Point S3: 1.2694
Daily Pivot Point R1: 1.2809
Daily Pivot Point R2: 1.2844
Daily Pivot Point R3: 1.2866
