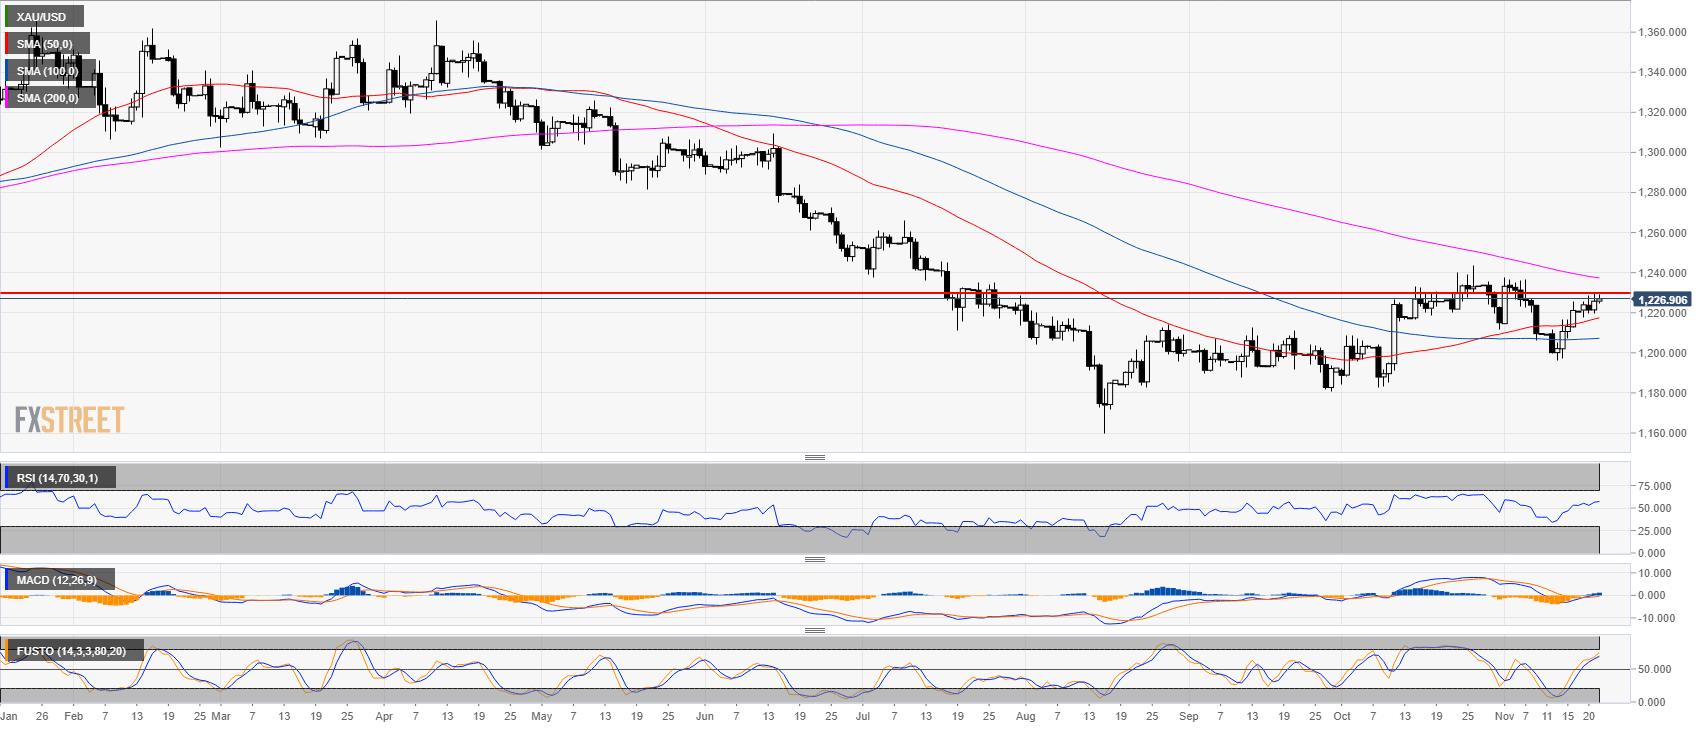
Daily chart
- Gold is trading in a bear trend below the 200-period simple moving average (SMAs).
- Bulls reclaimed the 50 and 100 SMA with the 50 SMA crossing above the 100 SMA.
- The RSI and Stochastic indicators are both trading above the 50 line while the MACD is also turning bullish.
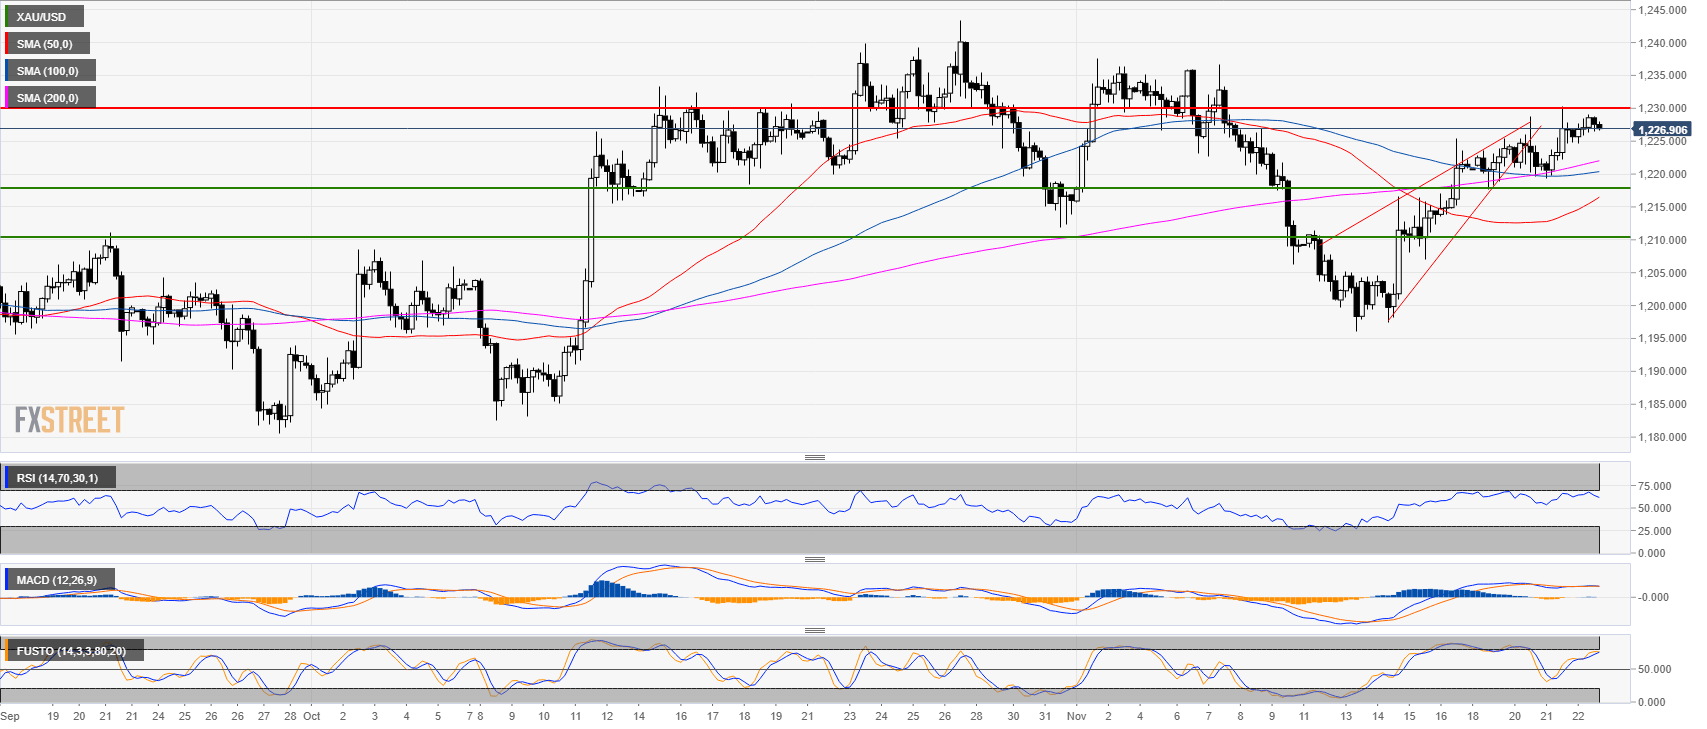
4-hour chart
- Gold found resistance at $1,230.00 a troy ounce.
- Gold formed a wedge-shaped pattern followed by a double top.
- A pullback to 1,217.70 should be next.
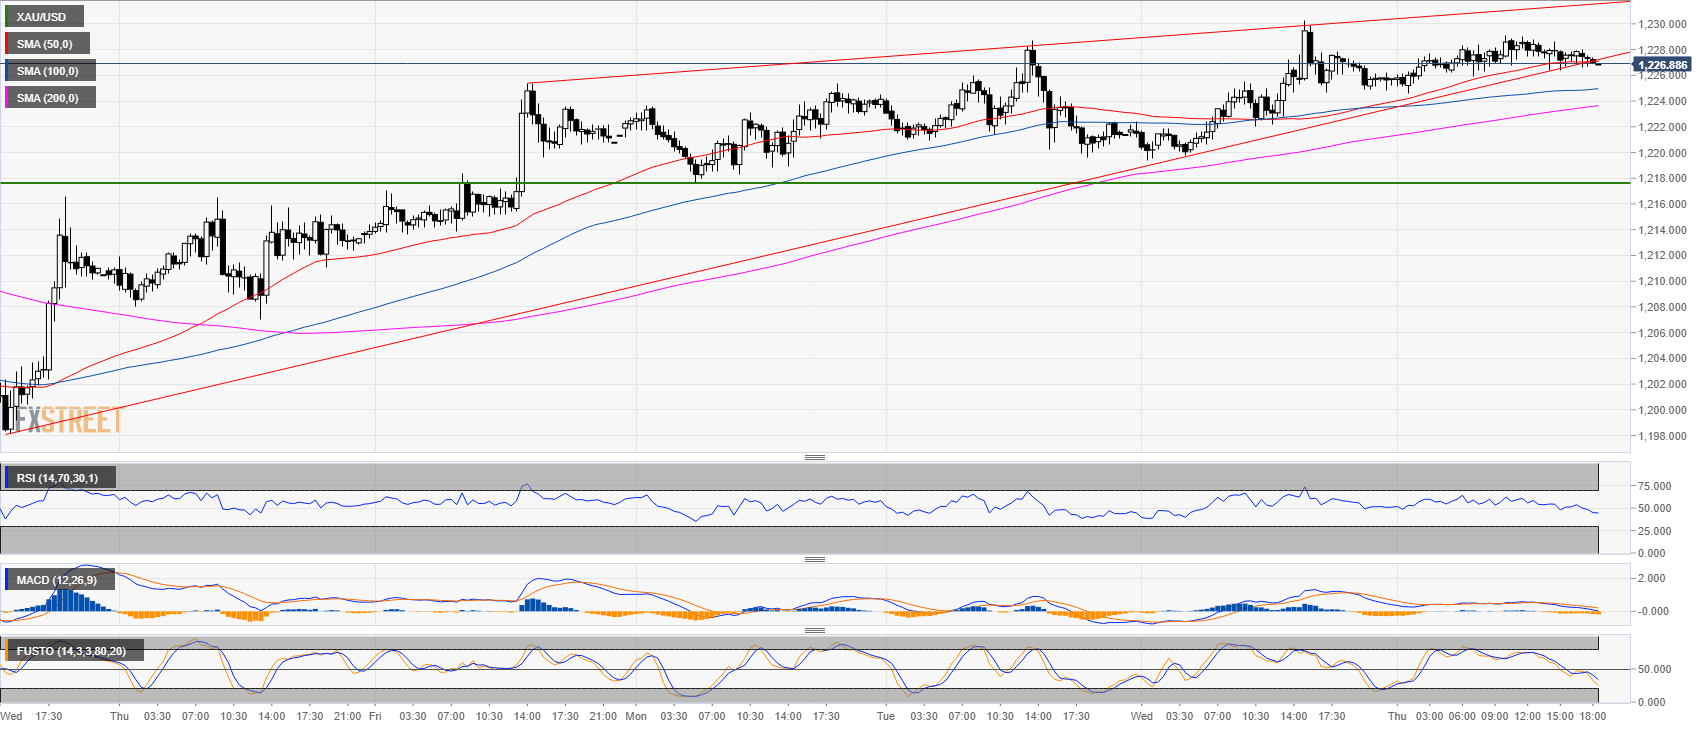
30-minute chart
- Technical indicators are losing their bullishness.
- All suggesting a breakdown to 1,217.00
Additional key levels
XAU/USD
Overview:
Last Price: 1226.93
Daily change: 1.2e+2 pips
Daily change: 0.0946%
Daily Open: 1225.77
Trends:
Daily SMA20: 1218.93
Daily SMA50: 1216.81
Daily SMA100: 1207.08
Daily SMA200: 1237.73
Levels:
Daily High: 1230.3
Daily Low: 1219.4
Weekly High: 1225.4
Weekly Low: 1196
Monthly High: 1243.43
Monthly Low: 1182.54
Daily Fibonacci 38.2%: 1226.14
Daily Fibonacci 61.8%: 1223.56
Daily Pivot Point S1: 1220.01
Daily Pivot Point S2: 1214.26
Daily Pivot Point S3: 1209.11
Daily Pivot Point R1: 1230.91
Daily Pivot Point R2: 1236.06
Daily Pivot Point R3: 1241.81
