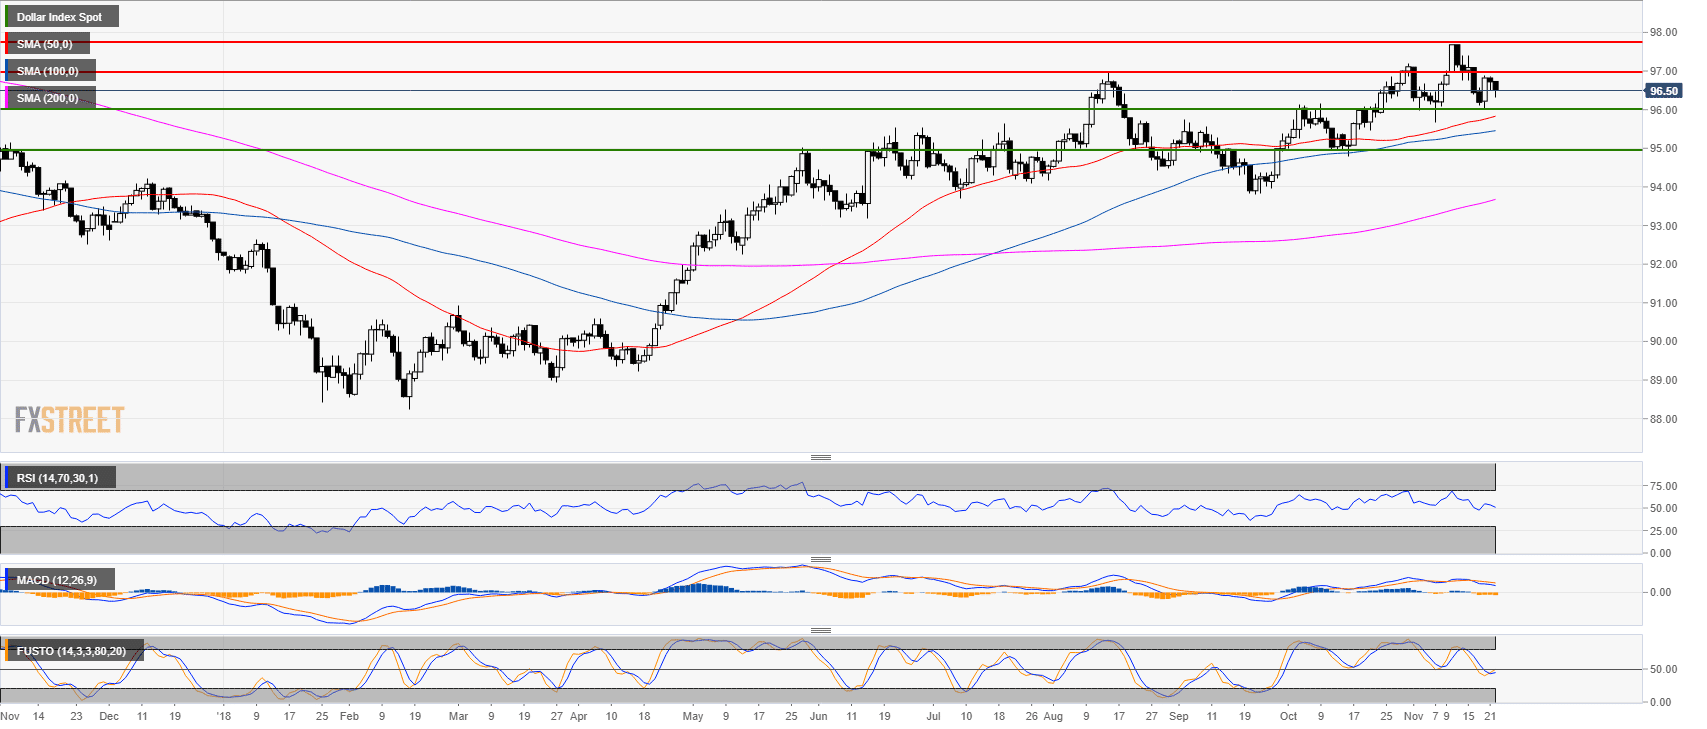
US Dollar Index (DXY) daily chart
- DXY is trading in a bull trend above the 50, 100 and 200-day simple moving averages (SMAs).
- DXY retreated slightly this Thursday but still holding above the 96.00 figure.
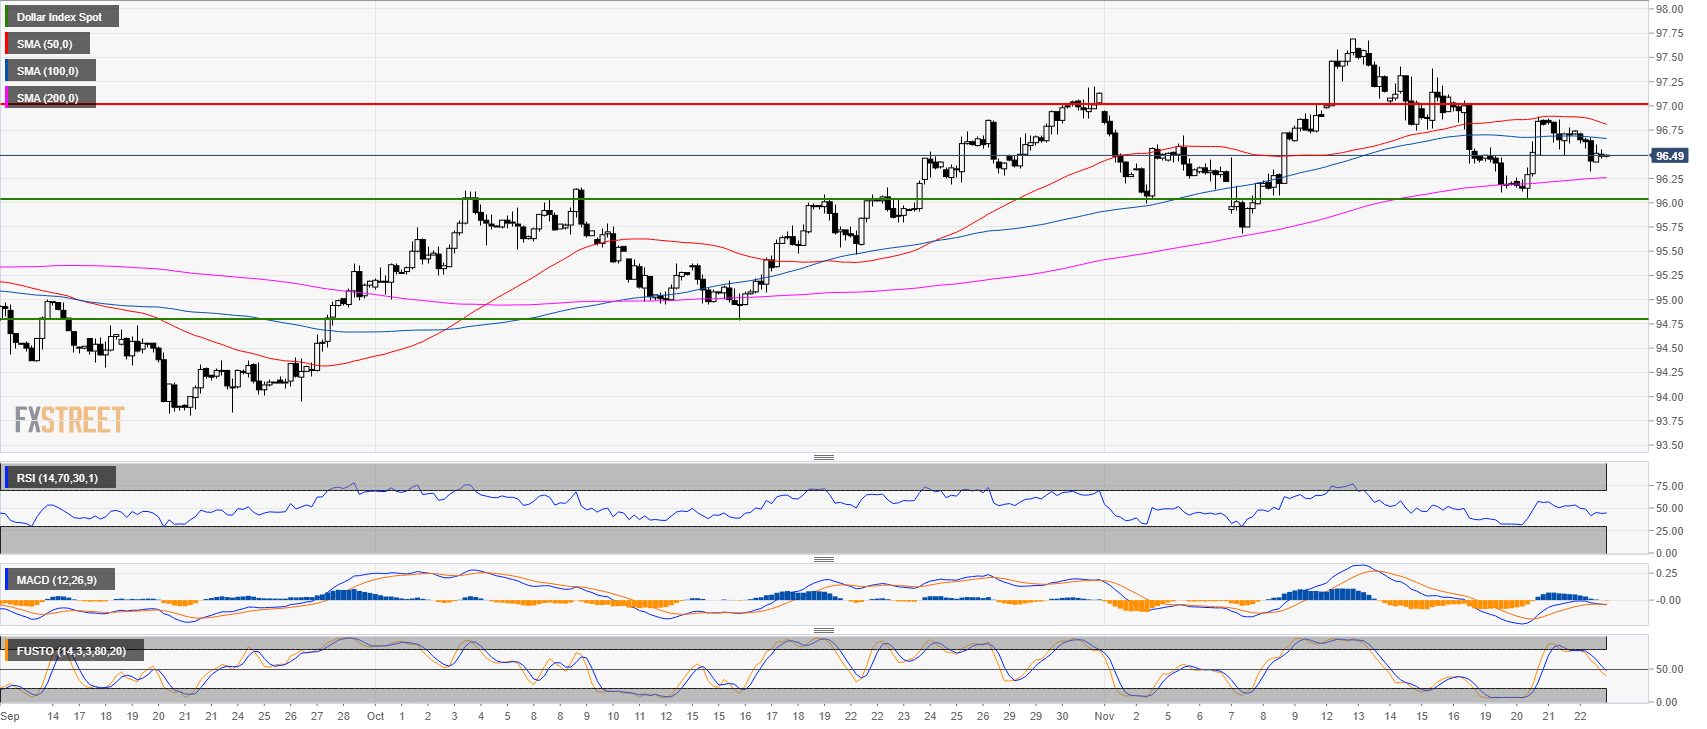
DXY 4-hour chart
- DXY is trading above the 200 SMA.
- The RSI and Stochastic indicators are below the 50 line while the MACD is turning negative.
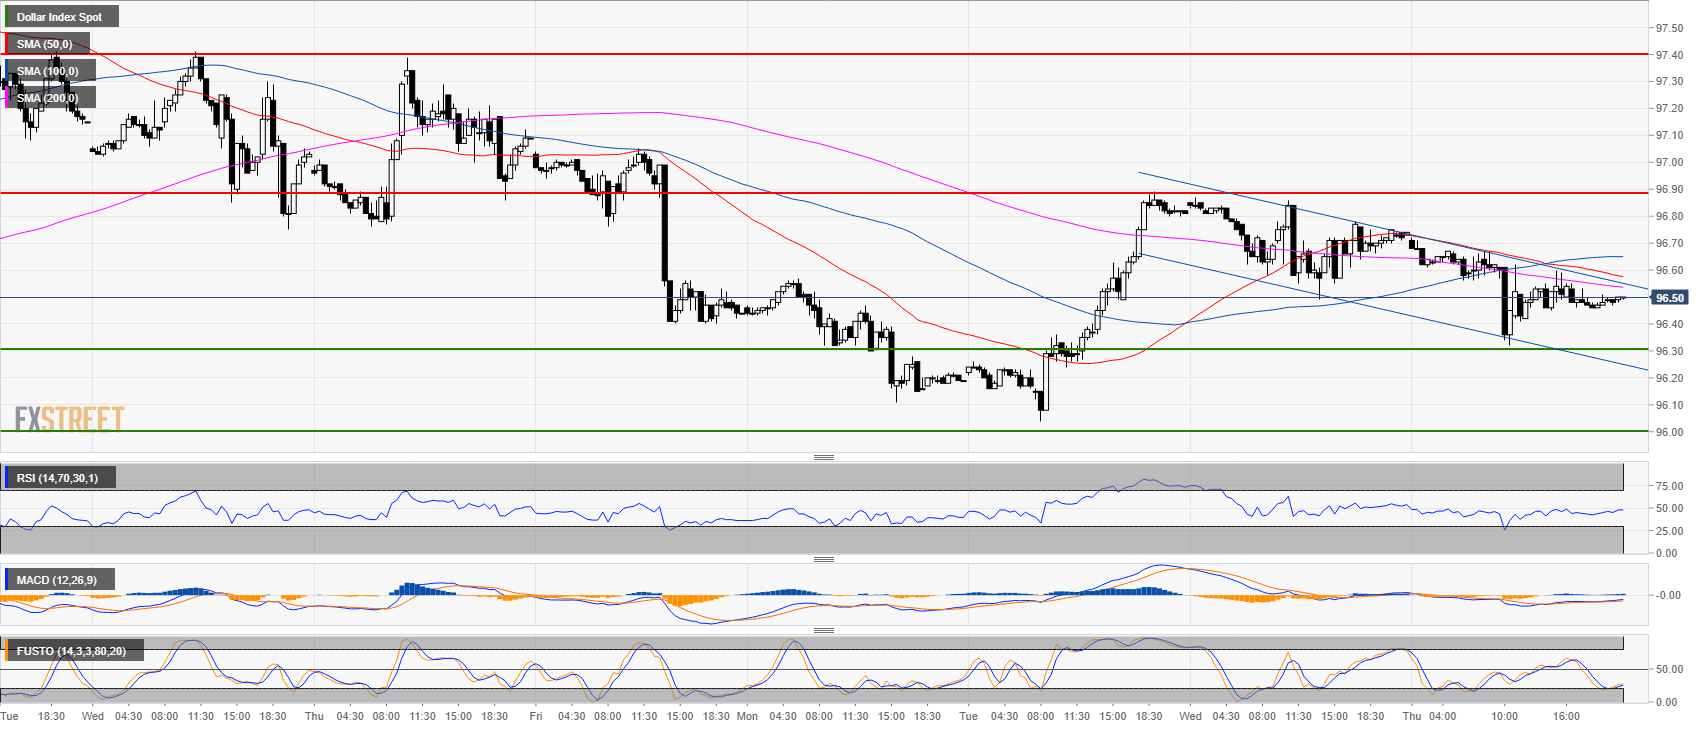
DXY 30-minute chart
- DXY is trading in a bull flag. Bulls will need to retake 96.60 to lift the market to 96.90.
- Support is seen at 96.30 and 96.00 figure.
Additional key levels
Dollar Index Spot
Overview:
Last Price: 96.5
Daily change: -22 pips
Daily change: -0.227%
Daily Open: 96.72
Trends:
Daily SMA20: 96.7
Daily SMA50: 95.79
Daily SMA100: 95.43
Daily SMA200: 93.64
Levels:
Daily High: 96.87
Daily Low: 96.49
Weekly High: 97.7
Weekly Low: 96.4
Monthly High: 97.2
Monthly Low: 94.79
Daily Fibonacci 38.2%: 96.64
Daily Fibonacci 61.8%: 96.72
Daily Pivot Point S1: 96.52
Daily Pivot Point S2: 96.31
Daily Pivot Point S3: 96.14
Daily Pivot Point R1: 96.9
Daily Pivot Point R2: 97.07
Daily Pivot Point R3: 97.28
