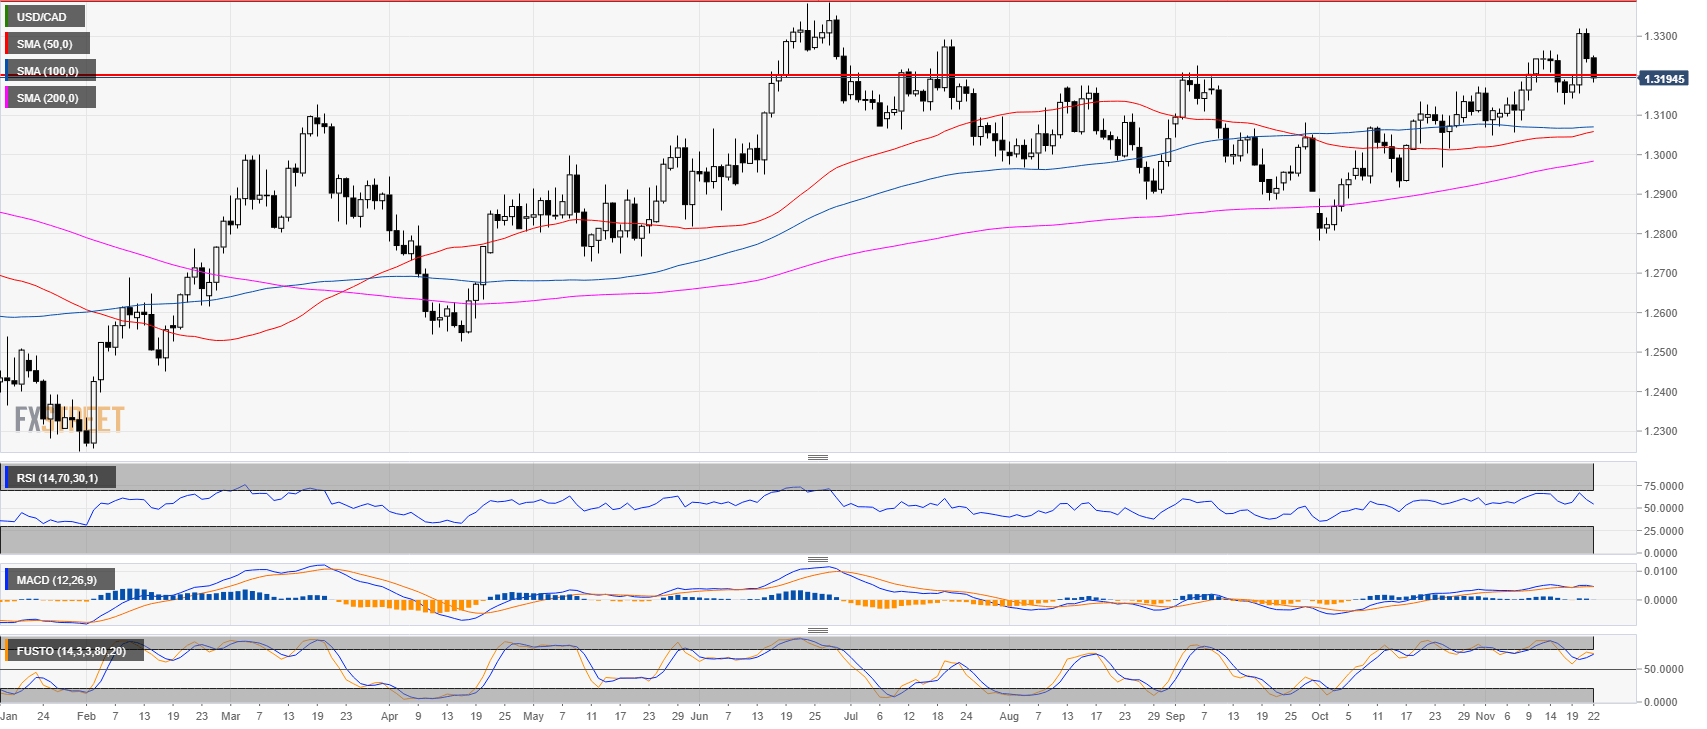
USD/CAD daily chart
- USD/CAD is trading in a bull trend above the 200-day simple moving average (SMA).
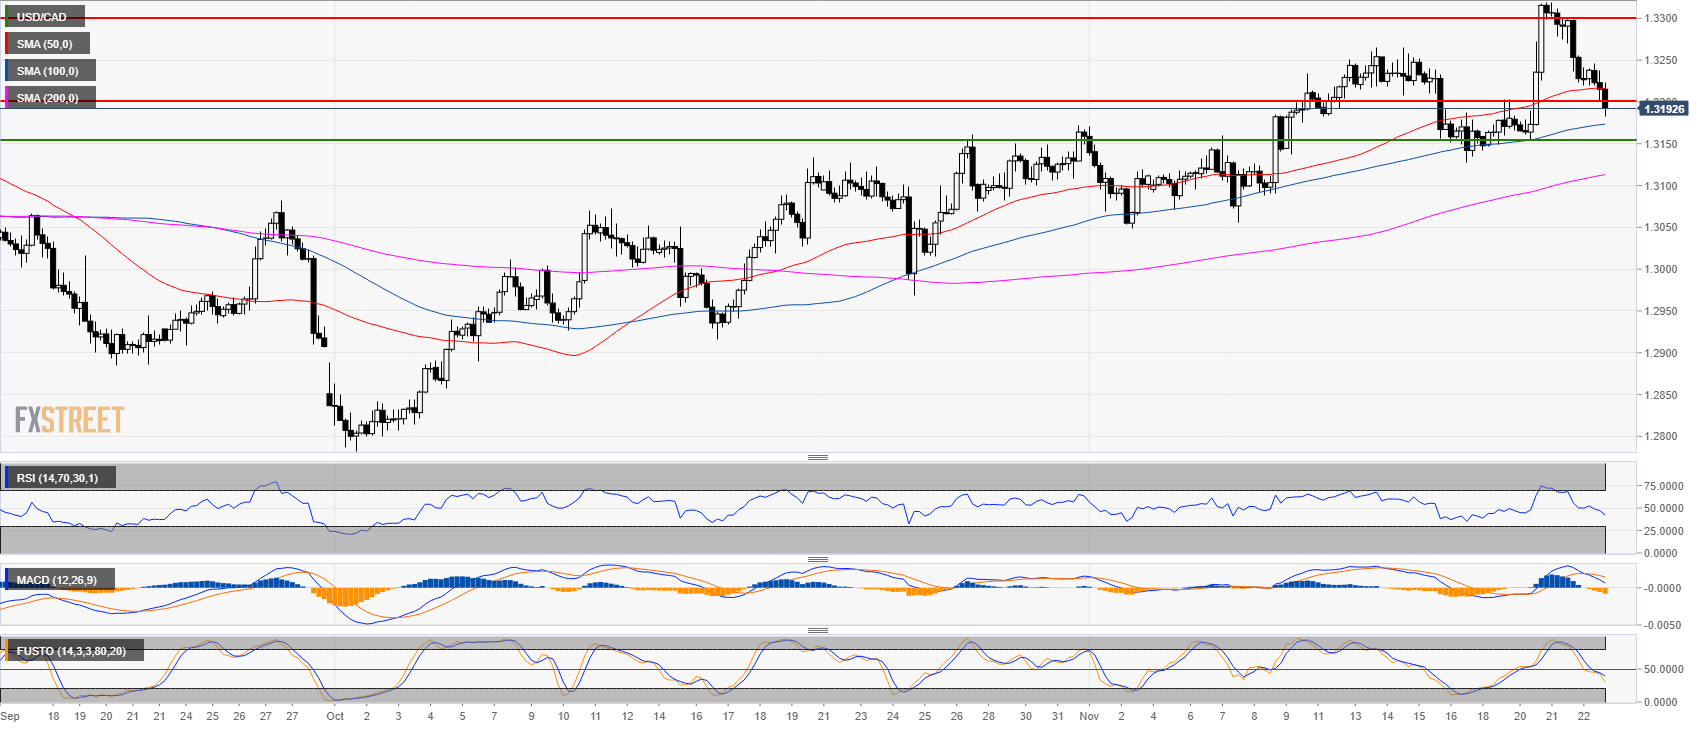
USD/CAD 4-hour chart
- USD/CAD slipped through the 50 SMA.
- Technical indicators turned bearish.
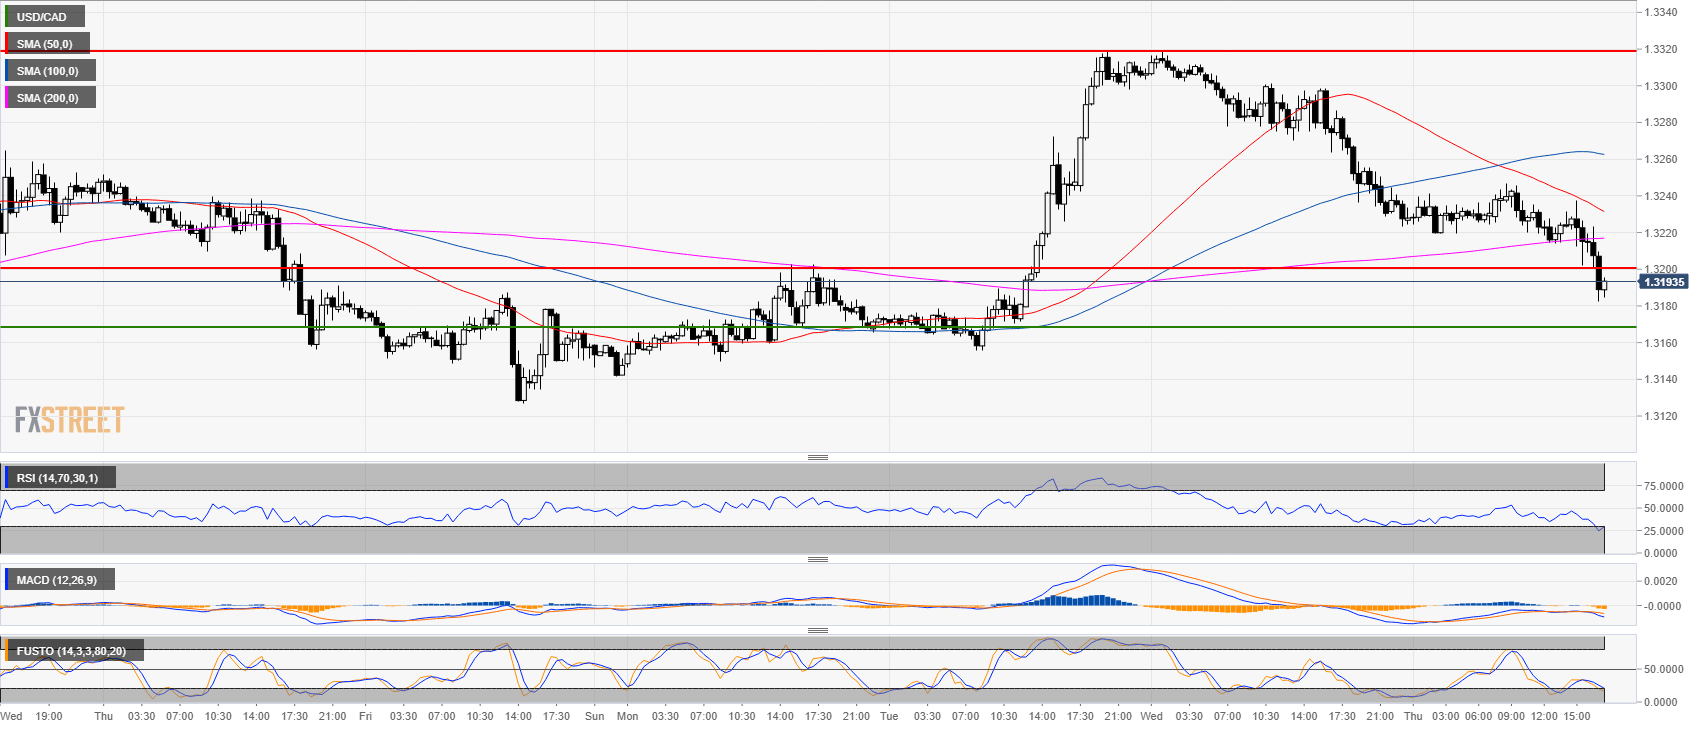
USD/CAD 30-minute chart
- USD/CAD is likely targeting the 1.3150 level.
Additional key levels
USD/CAD
Overview:
Last Price: 1.3189
Daily change: -55 pips
Daily change: -0.415%
Daily Open: 1.3244
Trends:
Daily SMA20: 1.3164
Daily SMA50: 1.3055
Daily SMA100: 1.307
Daily SMA200: 1.2976
Levels:
Daily High: 1.3318
Daily Low: 1.3234
Weekly High: 1.3264
Weekly Low: 1.3127
Monthly High: 1.3172
Monthly Low: 1.2783
Daily Fibonacci 38.2%: 1.3266
Daily Fibonacci 61.8%: 1.3286
Daily Pivot Point S1: 1.3212
Daily Pivot Point S2: 1.3181
Daily Pivot Point S3: 1.3128
Daily Pivot Point R1: 1.3297
Daily Pivot Point R2: 1.335
Daily Pivot Point R3: 1.3381
