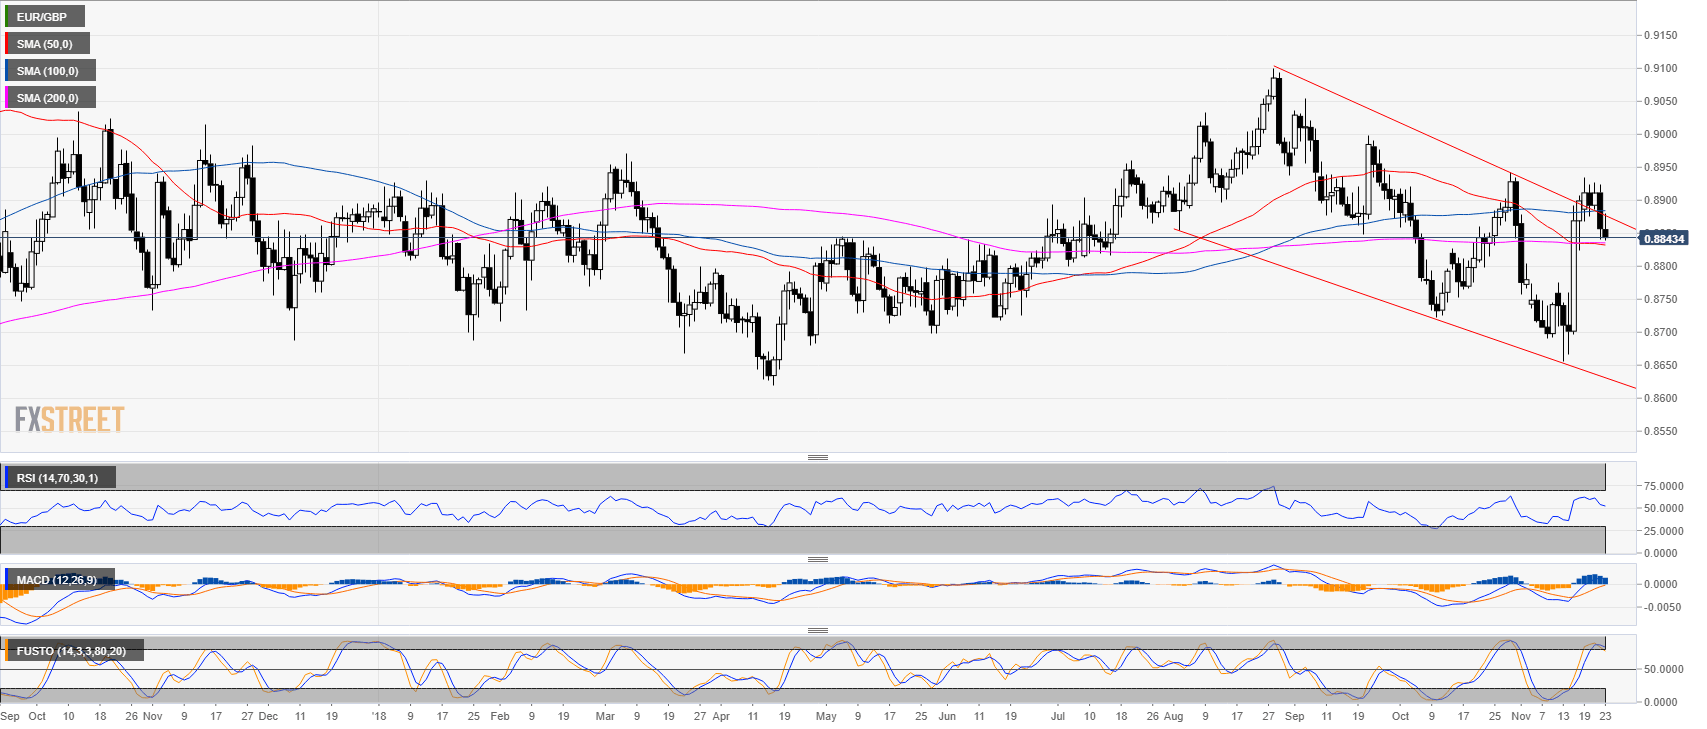
EUR/GBP daily chart
- EUR/GBP is trading just above its 50 and 200-day simple moving averages (SMA).
- Technical indicators are starting to decelerate.
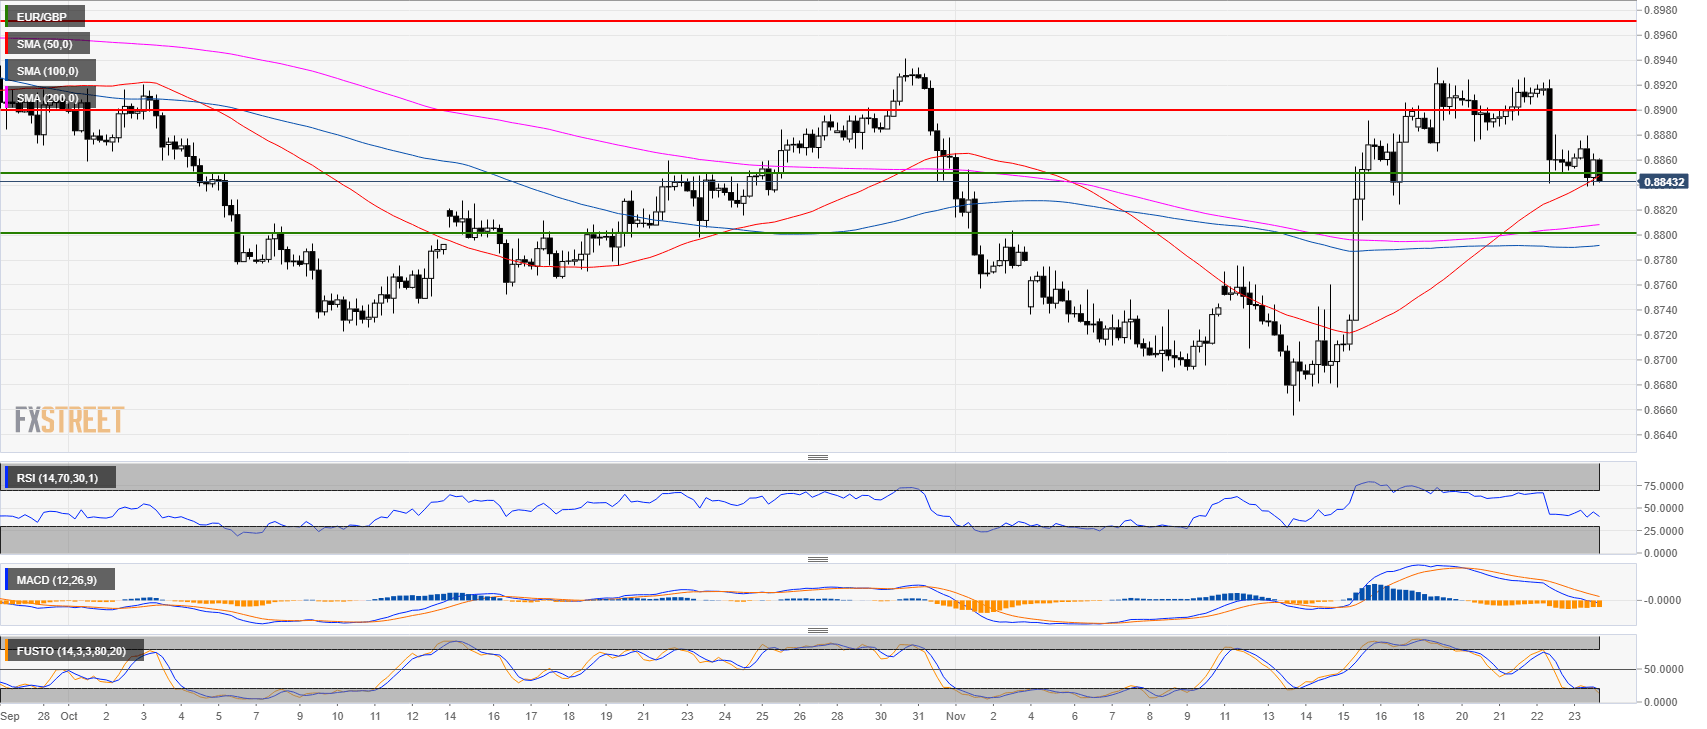
EUR/GBP 4-hour chart
- EUR/GBP is currently supported at the 50 SMA and near the 0.8840 level.
- Technical indicators are bearish suggesting further weakness to 0.8800 figure.
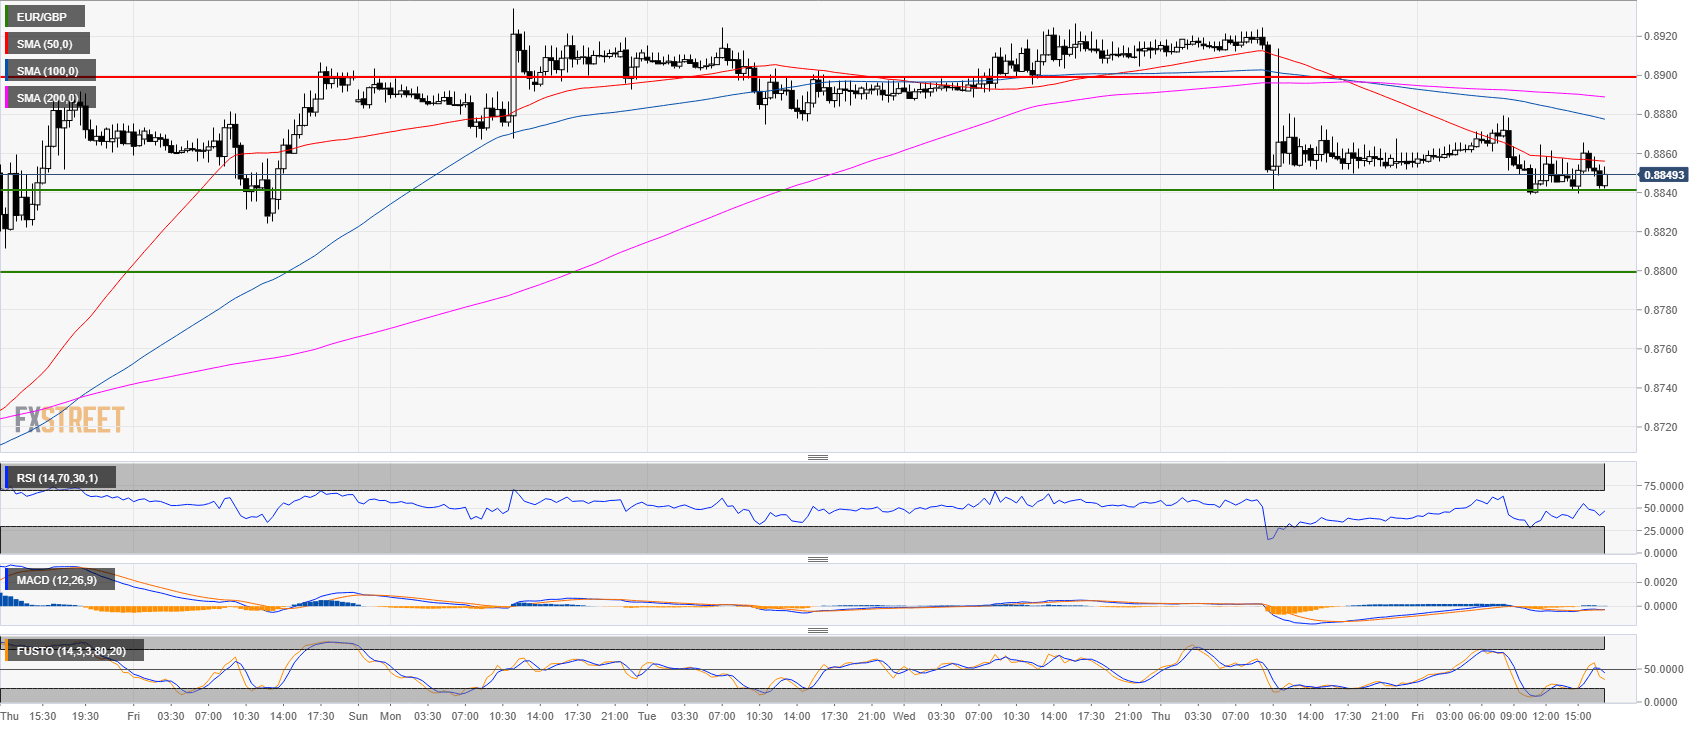
EUR/GBP 30-minute chart
- EUR/GBP is trading below its mains SMAs while technical indicators are negative.
- All suggesting further weakness.
Additional key levels:
EUR/GBP
Overview:
Last Price: 0.8844
Daily change: -13 pips
Daily change: -0.147%
Daily Open: 0.8857
Trends:
Daily SMA20: 0.8811
Daily SMA50: 0.8833
Daily SMA100: 0.8884
Daily SMA200: 0.8836
Levels:
Daily High: 0.8924
Daily Low: 0.8841
Weekly High: 0.8906
Weekly Low: 0.8656
Monthly High: 0.8942
Monthly Low: 0.8722
Daily Fibonacci 38.2%: 0.8873
Daily Fibonacci 61.8%: 0.8893
Daily Pivot Point S1: 0.8824
Daily Pivot Point S2: 0.879
Daily Pivot Point S3: 0.874
Daily Pivot Point R1: 0.8907
Daily Pivot Point R2: 0.8958
Daily Pivot Point R3: 0.8991
