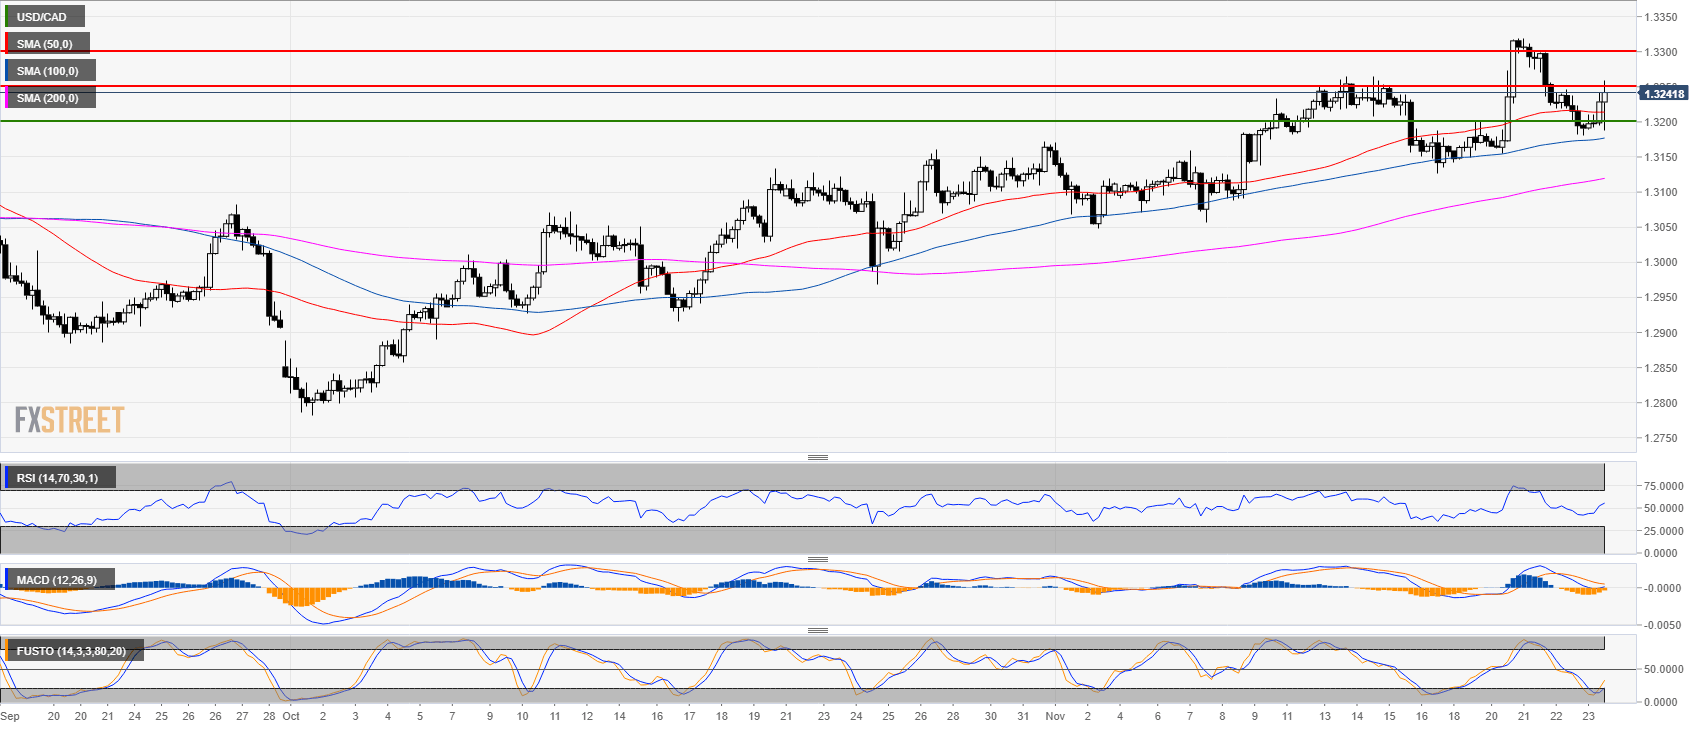
USD/CAD daily chart
- USD/CAD is trading in a bull trend above the 200-day simple moving average (SMA).
-636785805995040932.png)
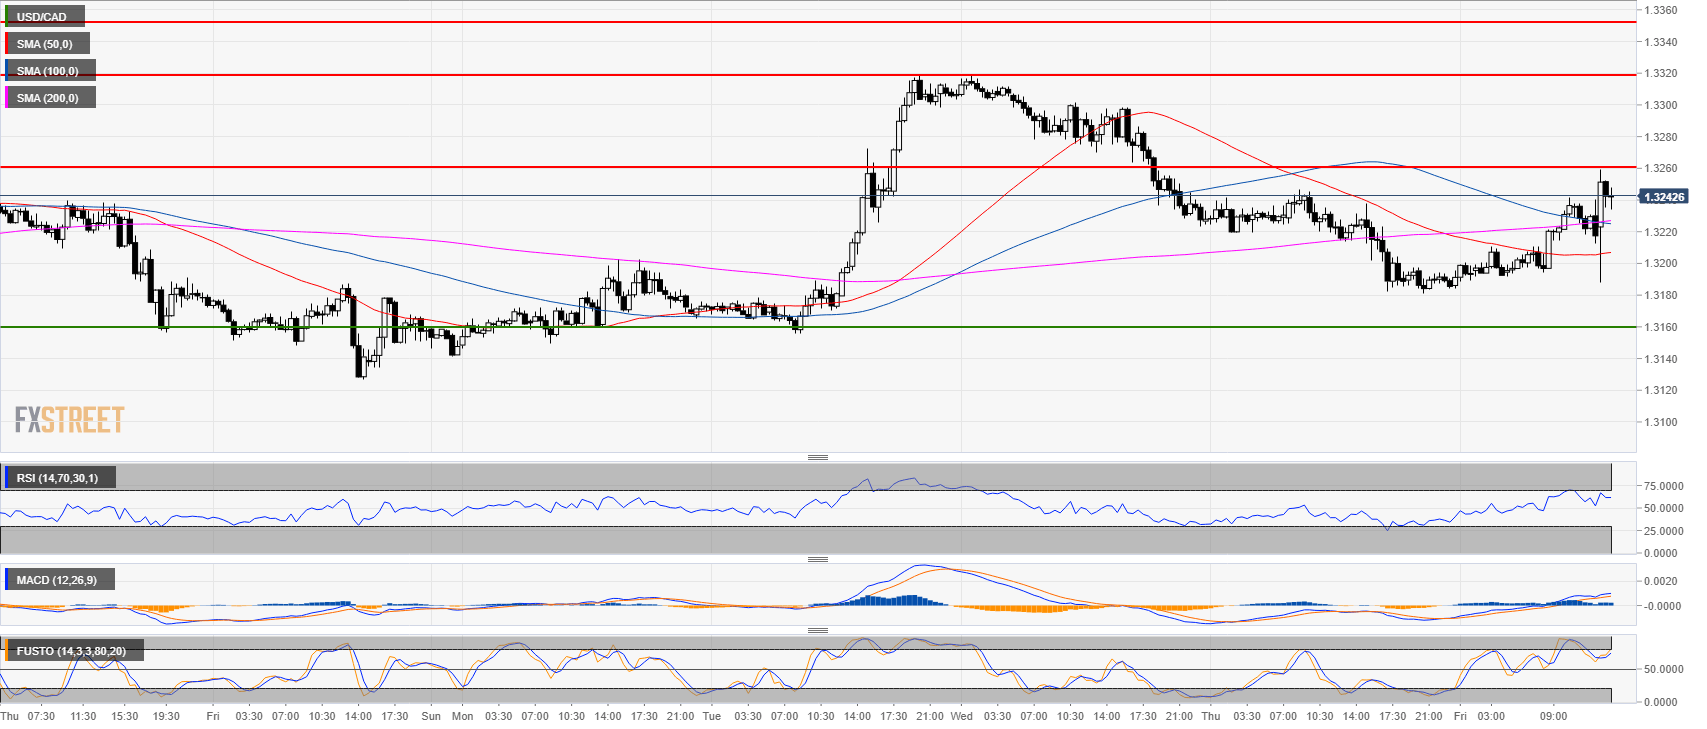
USD/CAD 4-hour chart
- USD/CAD found support at 1.3200 but bulls found solid resistance at the 1.3260 resistance.
- The RSI is above the 50 line, MACD is turning bullish and Stochastic is below the 50 line rebounding from oversold condition.
USD/CAD 30-minute chart
- USD/CAD is fading the spike to 1.3260 resistance.
- Technical indicators are slightly decelerating suggesting that further gains might be limited this Friday.
Additional key levels
USD/CAD
Overview:
Last Price: 1.3242
Daily change: 58 pips
Daily change: 0.440%
Daily Open: 1.3184
Trends:
Daily SMA20: 1.3169
Daily SMA50: 1.3058
Daily SMA100: 1.3071
Daily SMA200: 1.2979
Levels:
Daily High: 1.325
Daily Low: 1.3181
Weekly High: 1.3264
Weekly Low: 1.3127
Monthly High: 1.3172
Monthly Low: 1.2783
Daily Fibonacci 38.2%: 1.3208
Daily Fibonacci 61.8%: 1.3224
Daily Pivot Point S1: 1.316
Daily Pivot Point S2: 1.3136
Daily Pivot Point S3: 1.3091
Daily Pivot Point R1: 1.3229
Daily Pivot Point R2: 1.3275
Daily Pivot Point R3: 1.3299
