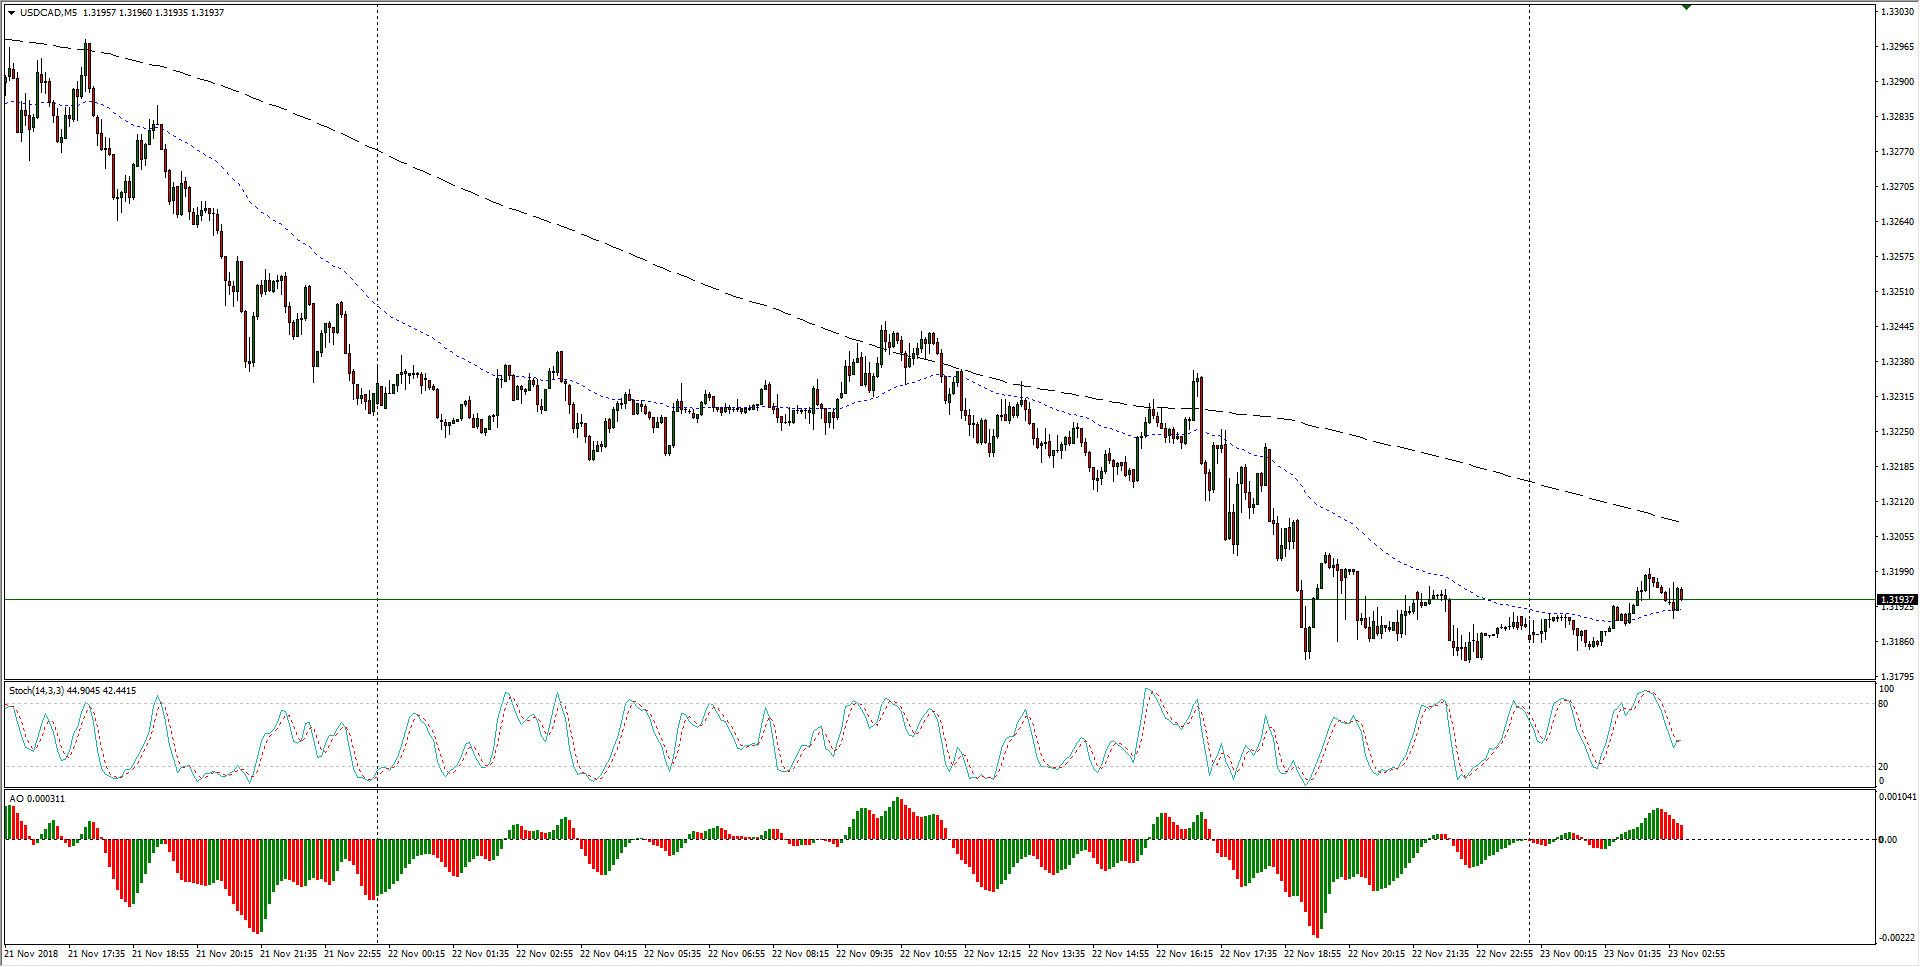
- The past twenty-four hours of trading activity on the USD/CAD has seen the pair slip from 1.3245 to just below the 1.3200 key handle, where bidders are looking to keep the pair on-balance.
USD/CAD Chart, 5-Minute
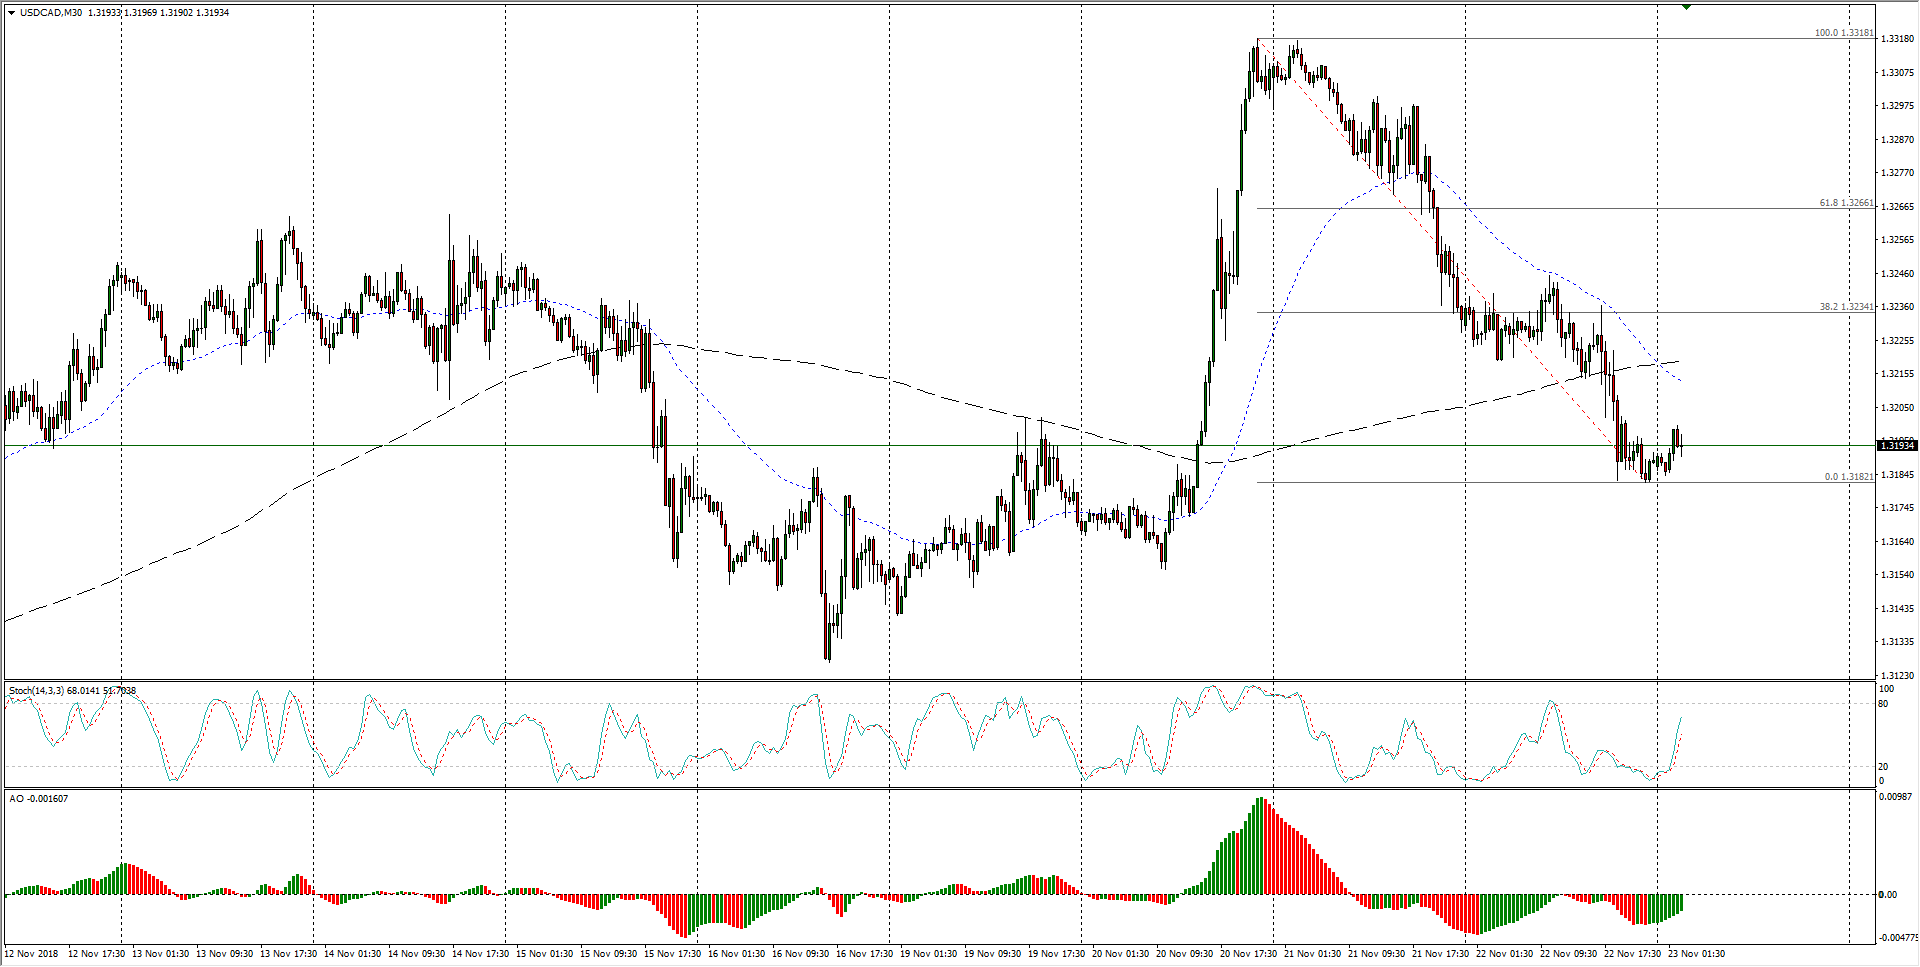
- The past two weeks have seen an accelerated rise and fall in the USD/CAD, but near-term technicals are leaning into the short side following a bearish cross of the 50- and 200-period moving averages, and current resistance for a bullish correction sits at the 38.2% Fibo retracement level at 1.3234.
USD/CAD Chart, 30-Minute
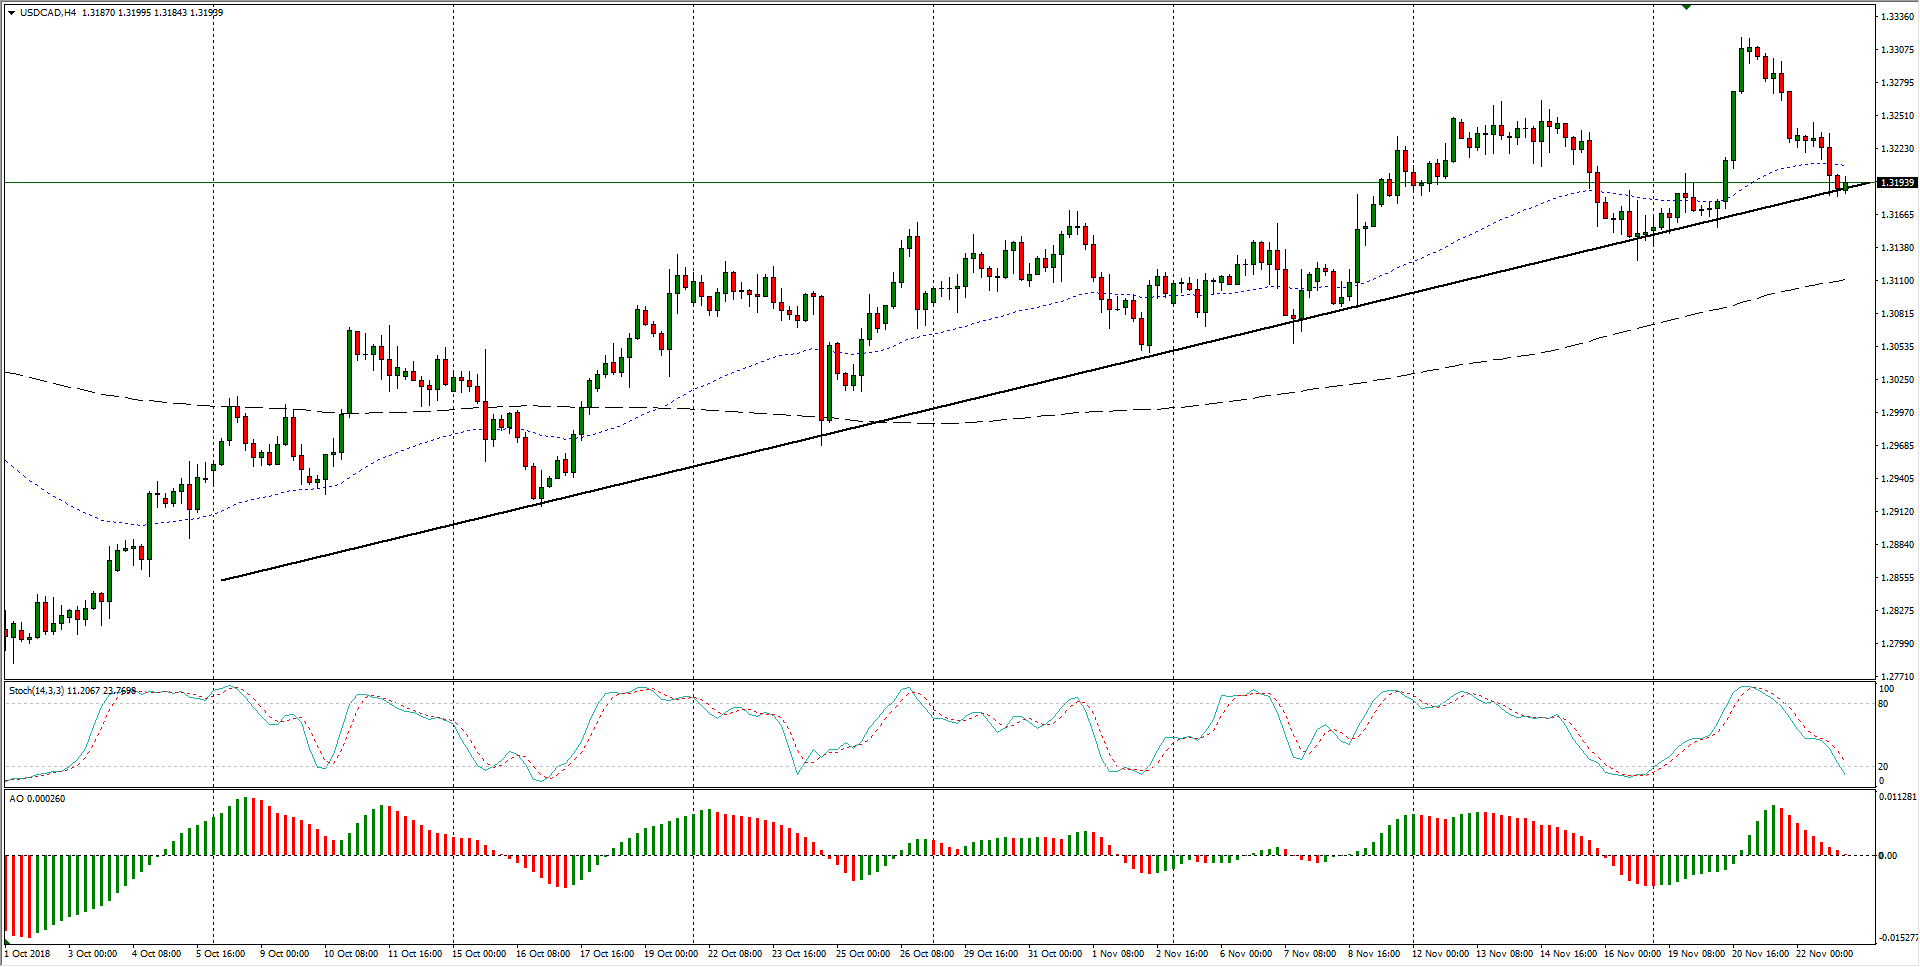
- The downside may turn out to be significantly limited, however: the past two months show a firm uptrend in place as lows march steadily higher, and the Dollar-Loonie pairing is currently challenging a rising trendline, with the 200-period moving average providing major trend support from 1.3110; any near-term moves towards the downside could face rapid rejection and a move further north.
USD/CAD Chart, 4-Hour
USD/CAD
Overview:
Last Price: 1.3194
Daily change: 10 pips
Daily change: 0.0758%
Daily Open: 1.3184
Trends:
Daily SMA20: 1.3169
Daily SMA50: 1.3058
Daily SMA100: 1.3071
Daily SMA200: 1.2979
Levels:
Daily High: 1.325
Daily Low: 1.3181
Weekly High: 1.3264
Weekly Low: 1.3127
Monthly High: 1.3172
Monthly Low: 1.2783
Daily Fibonacci 38.2%: 1.3208
Daily Fibonacci 61.8%: 1.3224
Daily Pivot Point S1: 1.316
Daily Pivot Point S2: 1.3136
Daily Pivot Point S3: 1.3091
Daily Pivot Point R1: 1.3229
Daily Pivot Point R2: 1.3275
Daily Pivot Point R3: 1.3299
