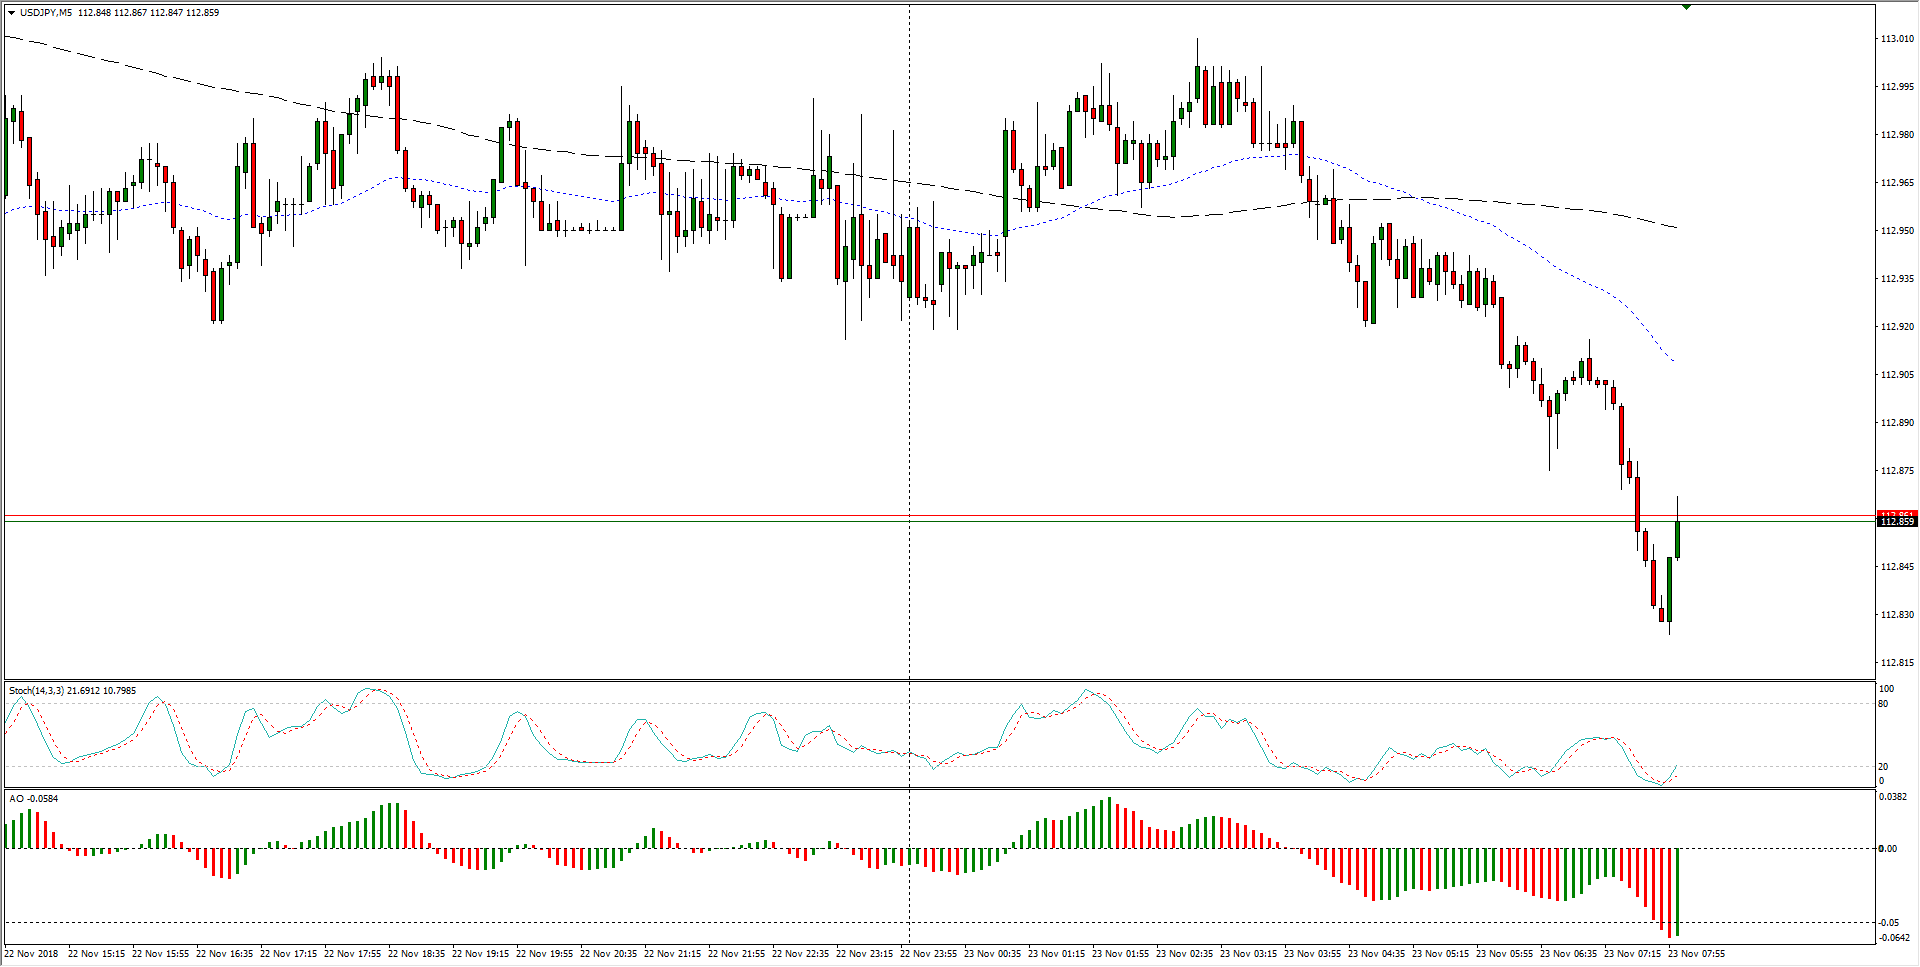
- The Dollar-Yen pairing took a quick dip into 112.82 in thin Asian markets as the JPY sees a quick round of bidding up, though with Japanese markets shuttered for the national holiday, the buying pressure on the Yen is unlikely to evolve into a meaningful trend change.
- The down move in the USD/JPY is already getting worked back, with the pair getting bounced back from the quick sell-off.
USD/JPY Chart, 5-Minute
- The USD/JPY has seen downside play over the past two weeks, and the 113.00 technical level is the current near-term ceiling on action.
USD/JPY Chart, 30-Minute
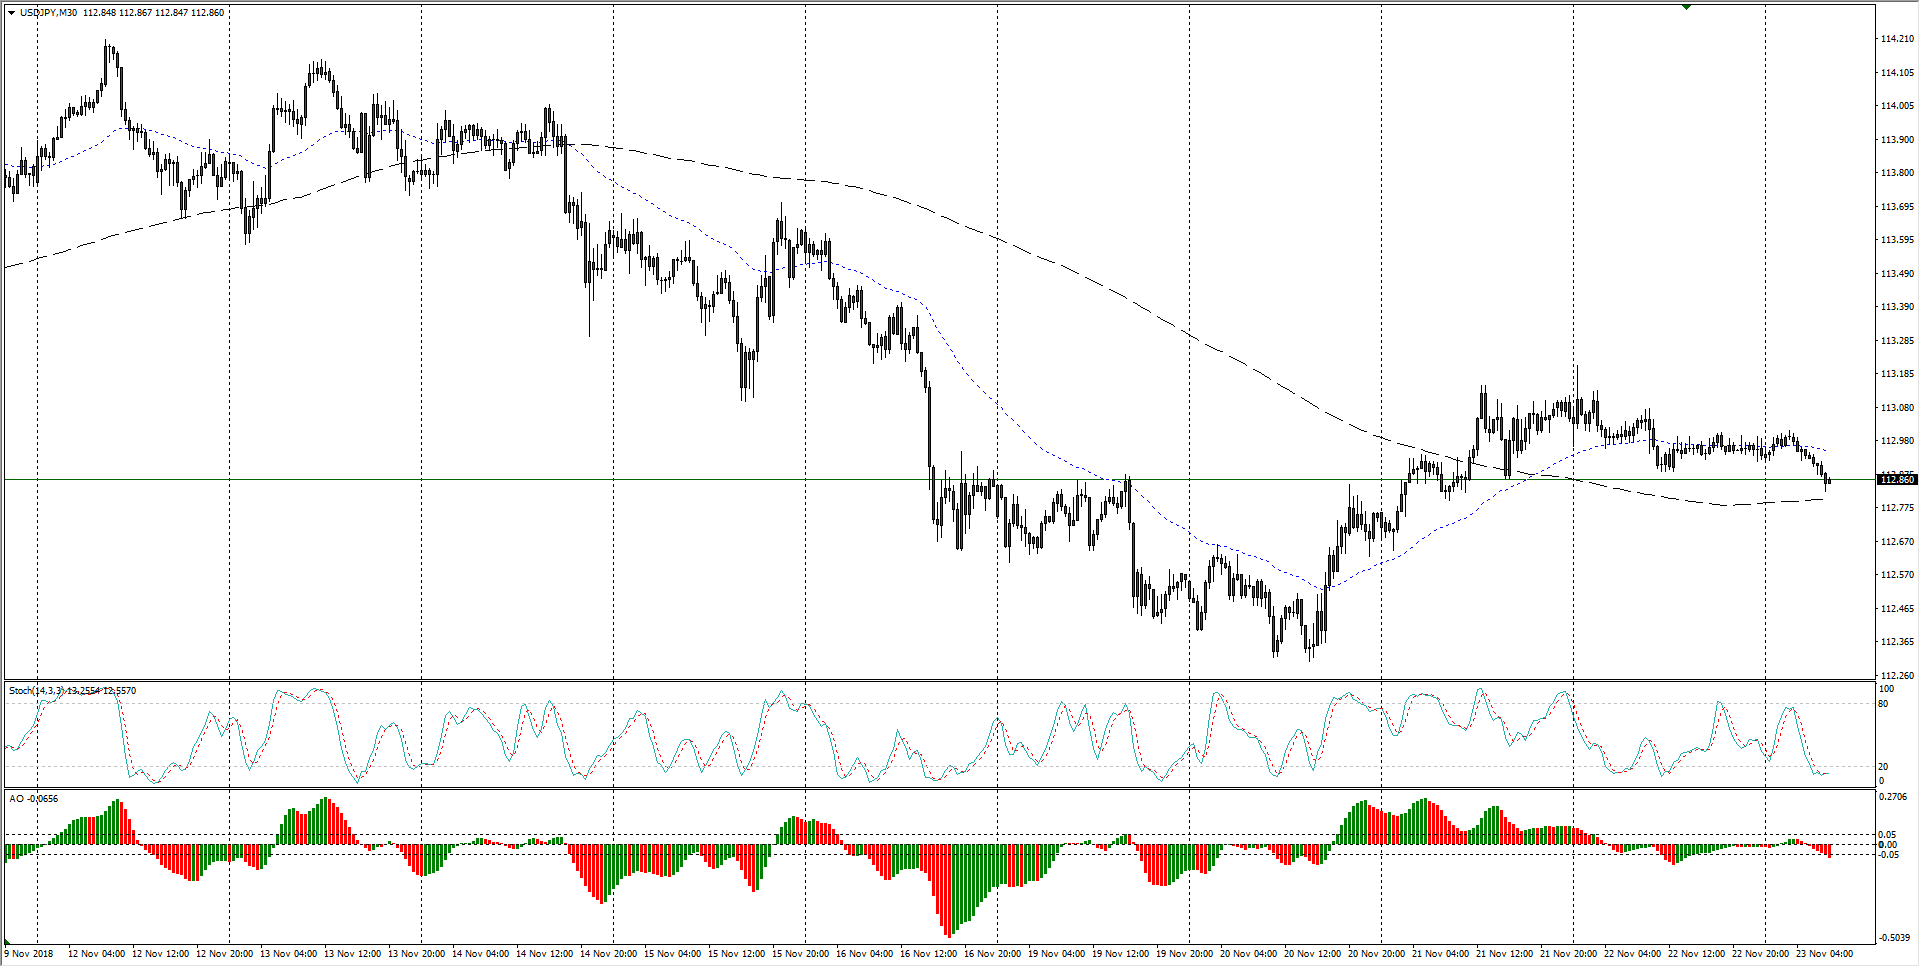
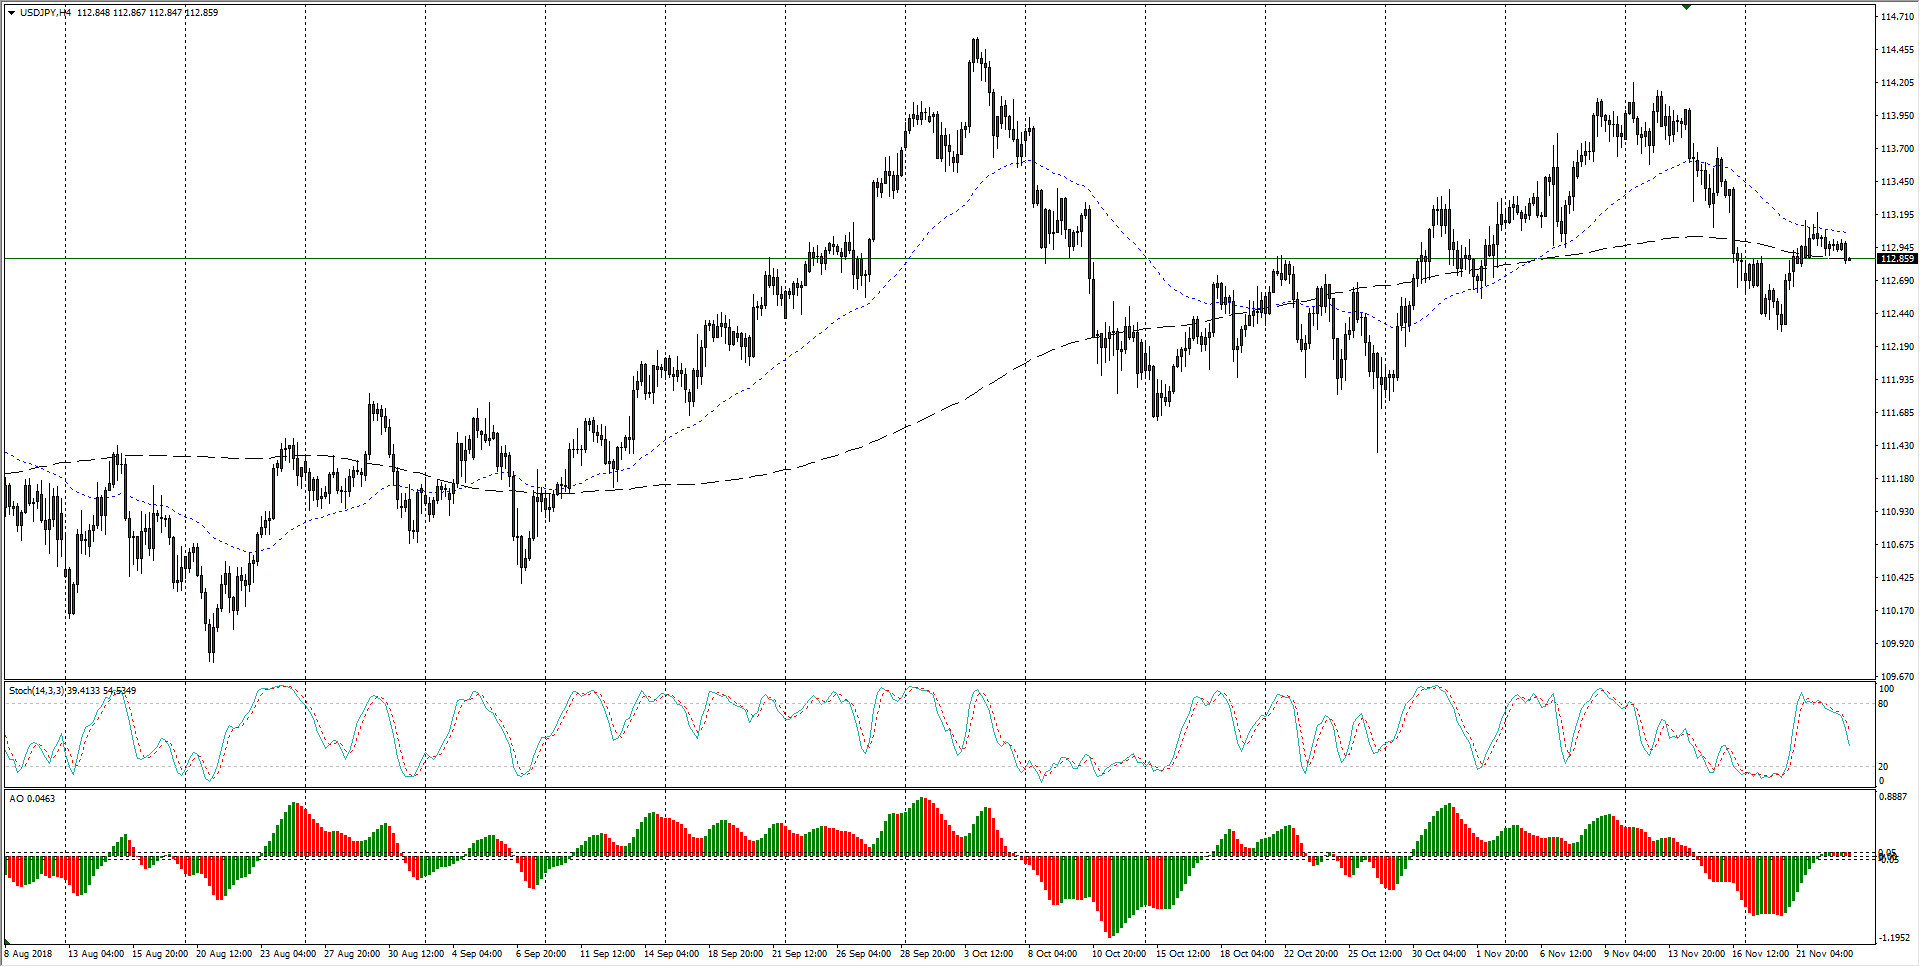
- The past four months see the USD/JPY beginning to wrap itself around the 200-period moving average, and this week’s lower high into 113.20 increases the odds of a new shortside pattern beginning to develop.
USD/JPY Chart, 4-Hour
USD/JPY
Overview:
Last Price: 112.85
Daily change: -11 pips
Daily change: -0.0974%
Daily Open: 112.96
Trends:
Daily SMA20: 113.14
Daily SMA50: 112.92
Daily SMA100: 112.12
Daily SMA200: 110.23
Levels:
Daily High: 113.24
Daily Low: 112.88
Weekly High: 114.22
Weekly Low: 112.64
Monthly High: 114.56
Monthly Low: 111.38
Daily Fibonacci 38.2%: 113.01
Daily Fibonacci 61.8%: 113.1
Daily Pivot Point S1: 112.81
Daily Pivot Point S2: 112.66
Daily Pivot Point S3: 112.44
Daily Pivot Point R1: 113.17
Daily Pivot Point R2: 113.39
Daily Pivot Point R3: 113.54
