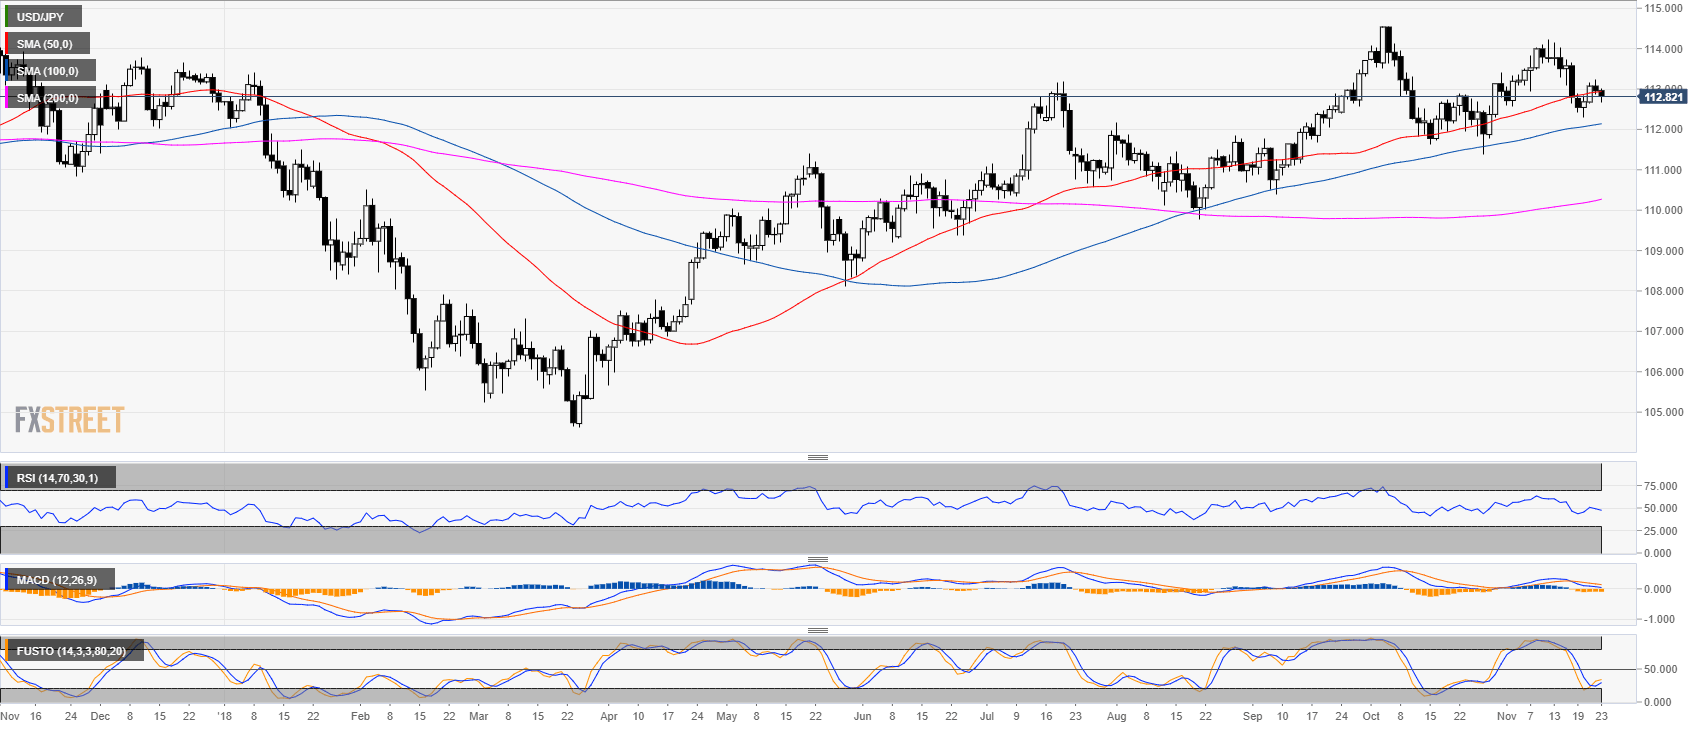
USD/JPY daily chart
- USD/JPY is trading just above the 50-day simple moving average (SMA).
- Technical indicators are mildly negative.
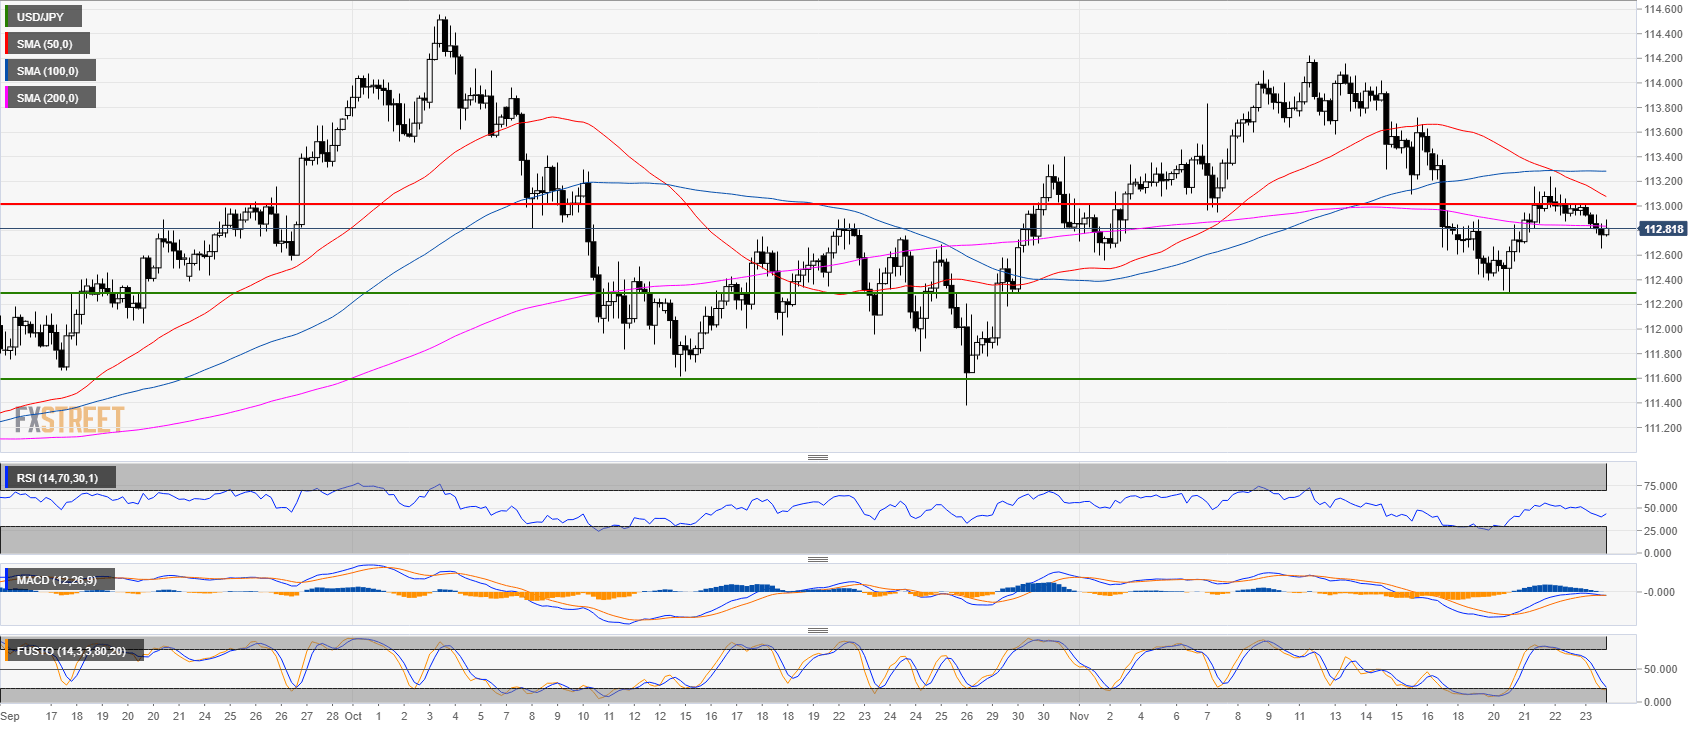
USD/JPY 4-hour chart
- USD/JPY is trading below its 50, 100 and 200 SMA.
- The RSI and Stochastic are below the 50 line while MACD is turning bearish.
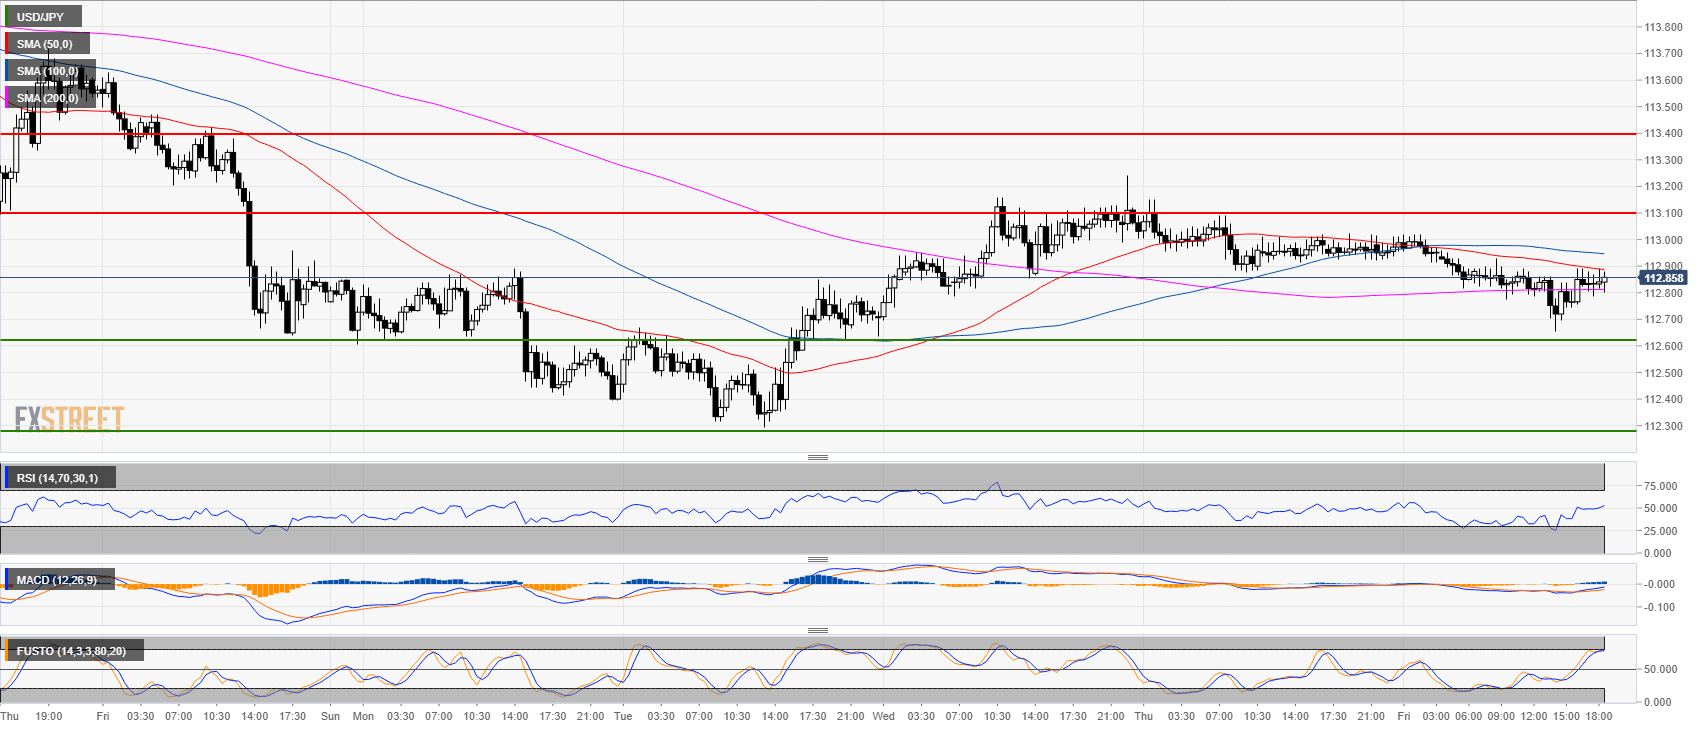
USD/JPY 30-minute chart
- USD/JPY is trading below its 50 and 100 SMA.
- USD/JPY is weakening after testing the 113.10 resistance two days ago.
Additional key levels:
USD/JPY
Overview:
Last Price: 112.82
Daily change: -14 pips
Daily change: -0.124%
Daily Open: 112.96
Trends:
Daily SMA20: 113.14
Daily SMA50: 112.92
Daily SMA100: 112.12
Daily SMA200: 110.23
Levels:
Daily High: 113.24
Daily Low: 112.88
Weekly High: 114.22
Weekly Low: 112.64
Monthly High: 114.56
Monthly Low: 111.38
Daily Fibonacci 38.2%: 113.01
Daily Fibonacci 61.8%: 113.1
Daily Pivot Point S1: 112.81
Daily Pivot Point S2: 112.66
Daily Pivot Point S3: 112.44
Daily Pivot Point R1: 113.17
Daily Pivot Point R2: 113.39
Daily Pivot Point R3: 113.54
