- Crude oil prices took another step lower in early Friday trading, pinging into the 52.60 territory before settling back near 53.25.
- WTI Chart, 5-Minute
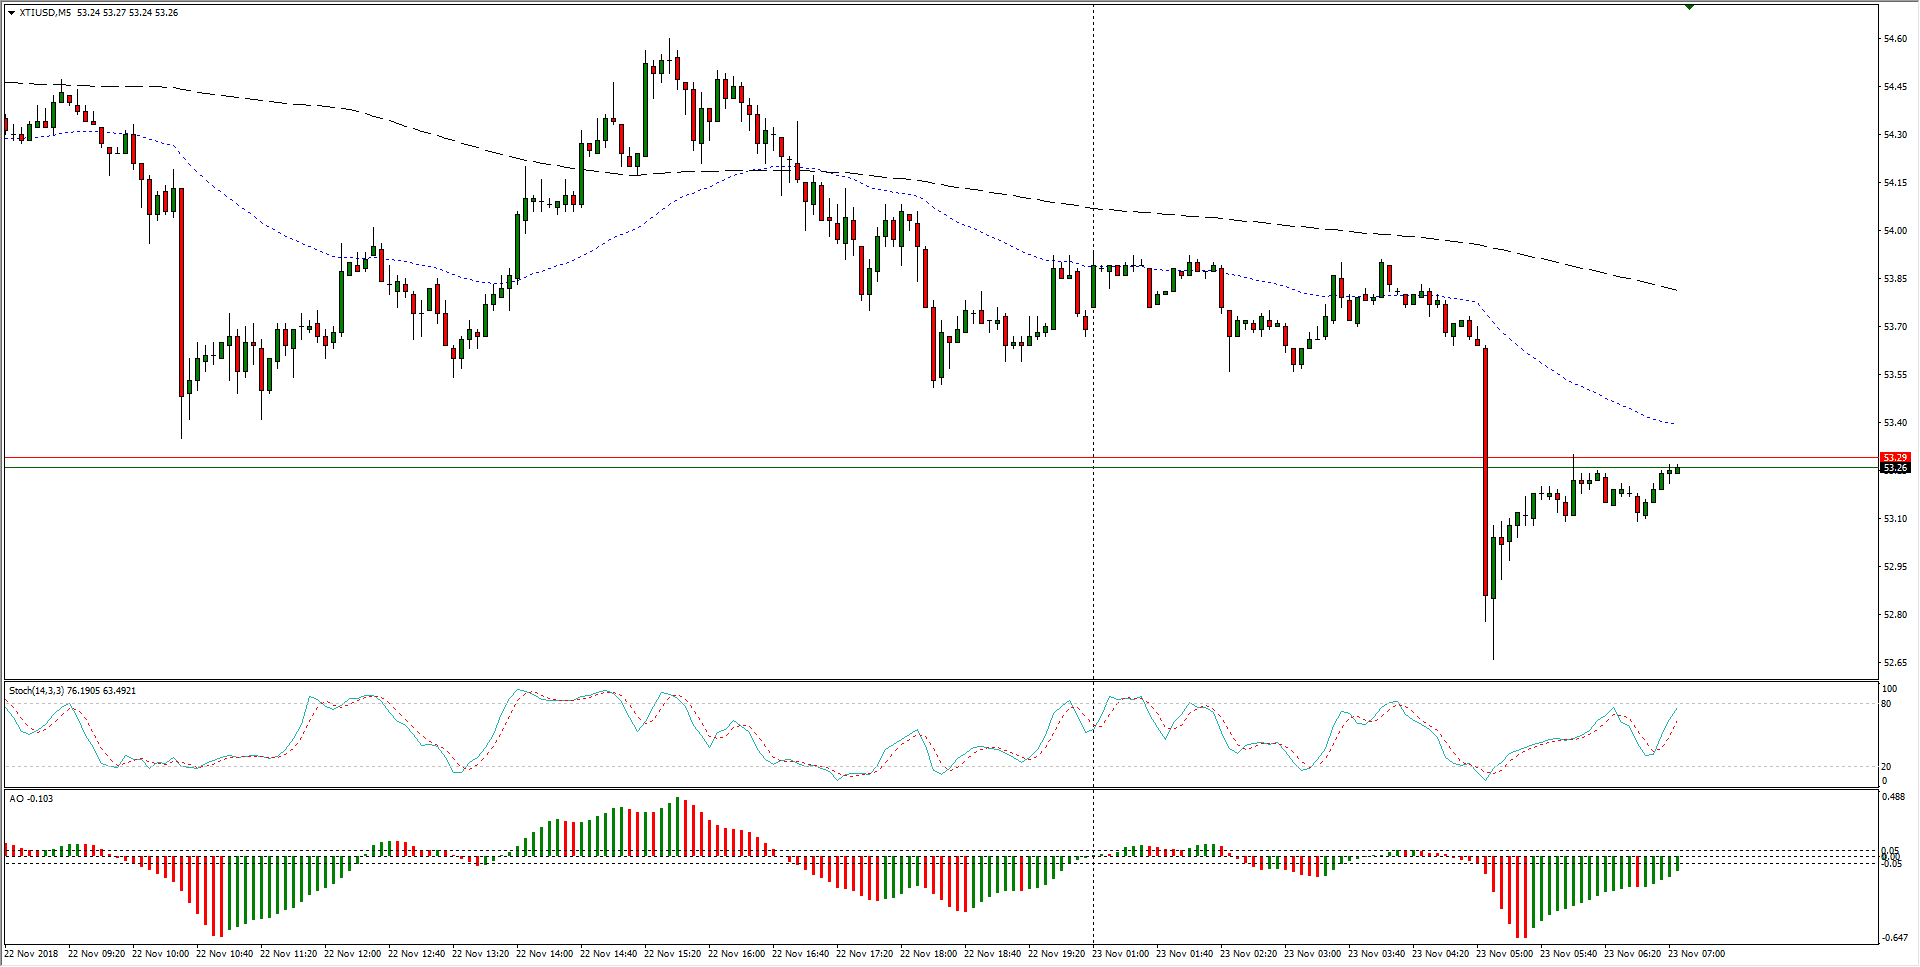
- Despite Friday’s early dip-and-rise, crude oil remains closely tied to recent action, with WTI currently chained to a range between the 38.2% Fibo retracement level at 54.36 and this week’s new low at 52.59.
WTI Chart, 30-Minute
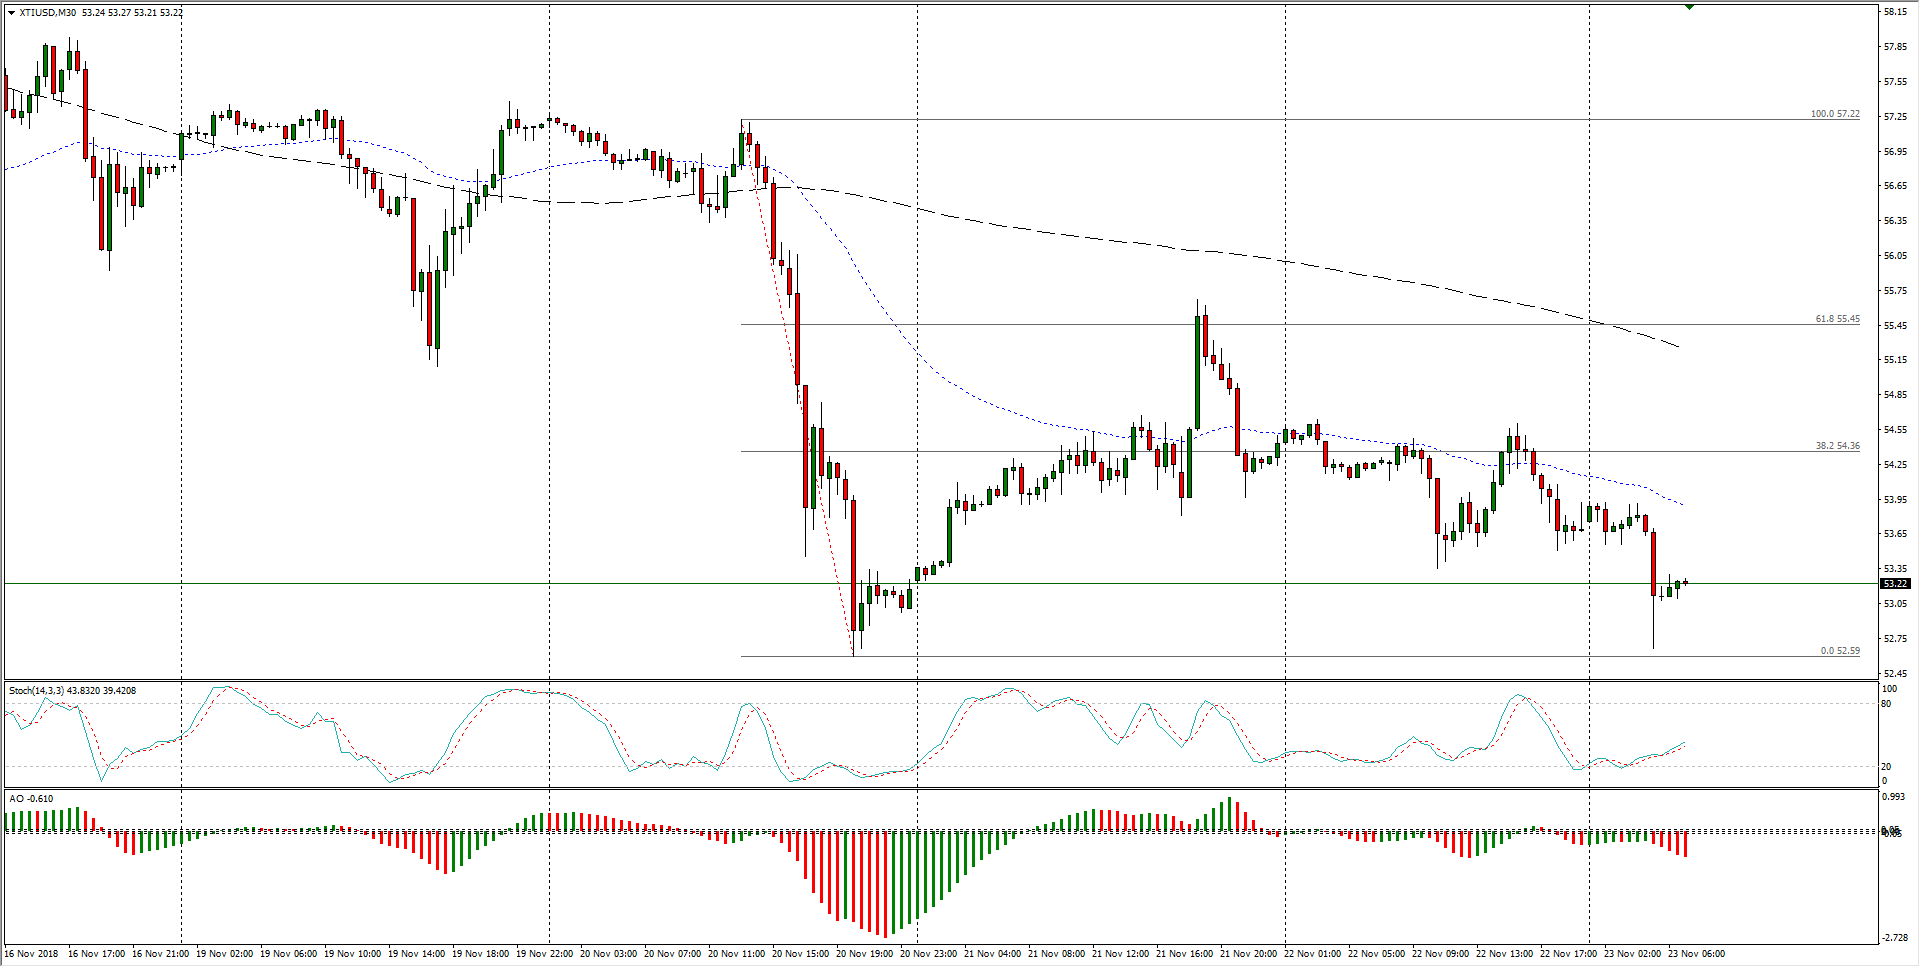
- Moving to the medium-term, crude barrel costs remain trapped in a steady bearish trend, set to close bearish for a seventh week straight as lower highs continue to mark in declining resistance as the 200-period moving average struggles to catch up to price action.
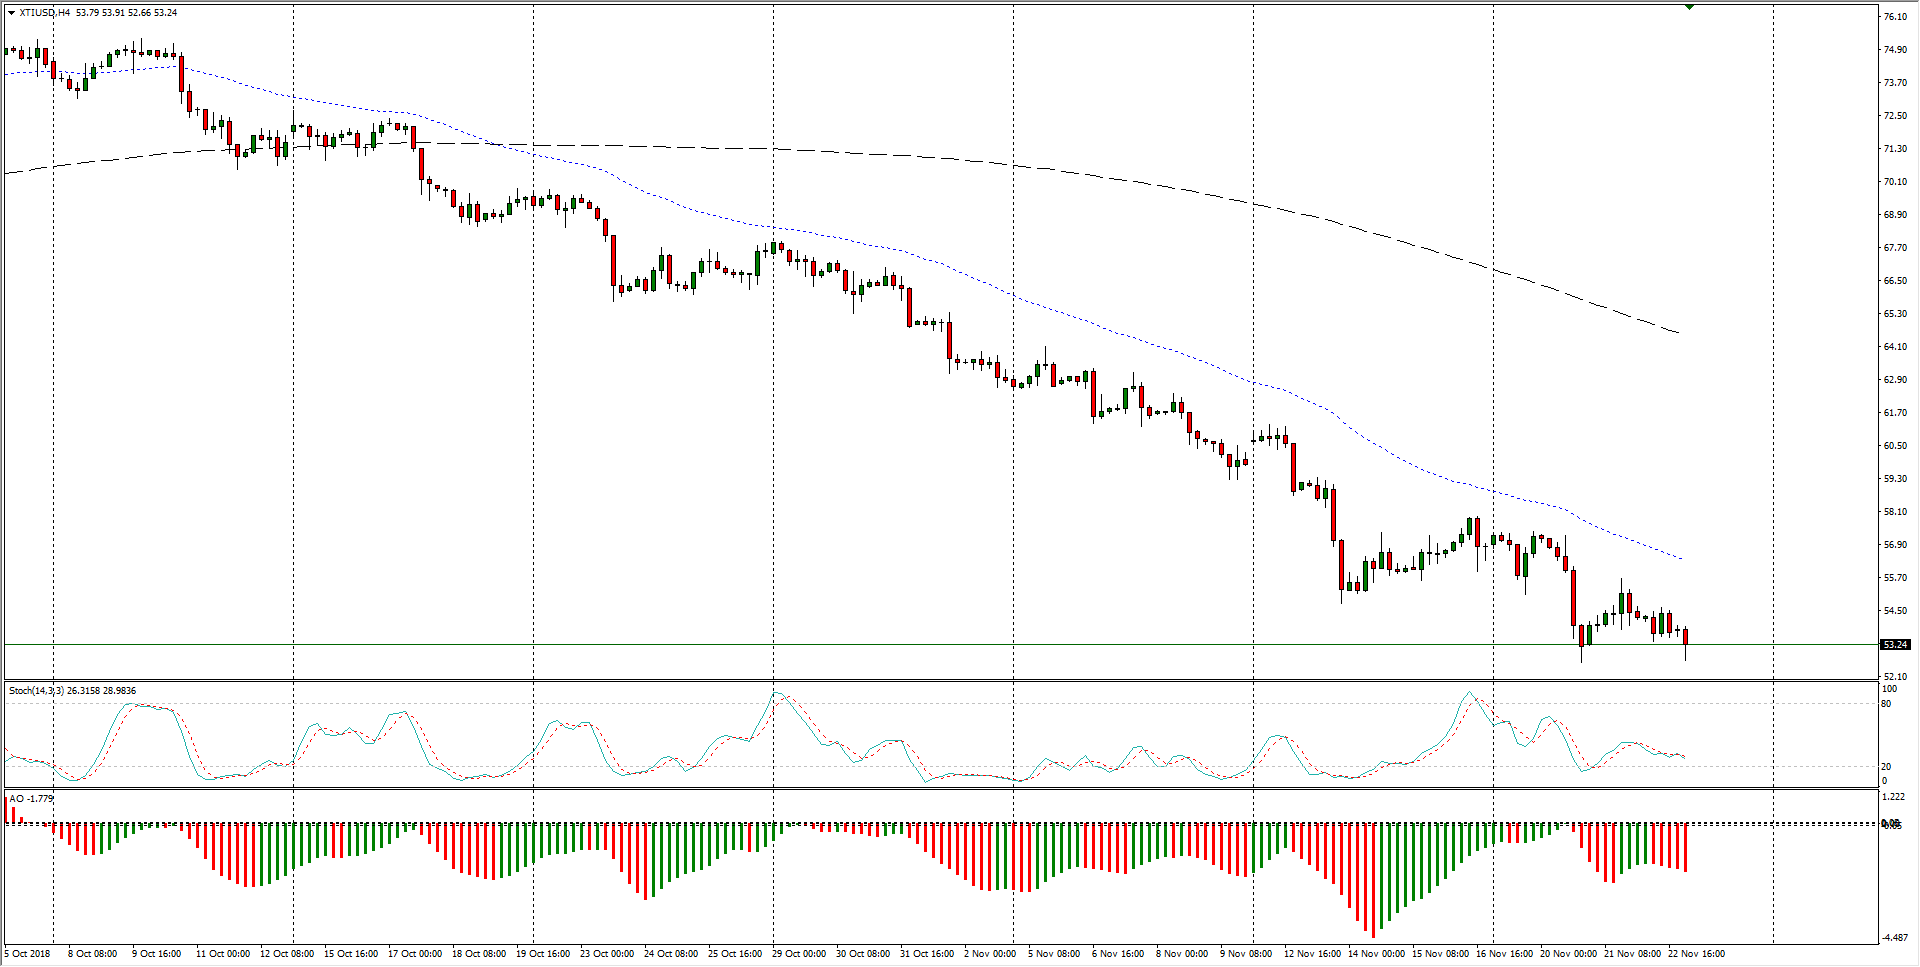
WTI Chart, 4-Hour
WTI
Overview:
Last Price: 53.38
Daily change: -62 pips
Daily change: -1.15%
Daily Open: 54
Trends:
Daily SMA20: 59.12
Daily SMA50: 66.36
Daily SMA100: 67.46
Daily SMA200: 68.05
Levels:
Daily High: 54.09
Daily Low: 53.84
Weekly High: 60.93
Weekly Low: 55.21
Monthly High: 76.25
Monthly Low: 64.86
Daily Fibonacci 38.2%: 53.99
Daily Fibonacci 61.8%: 53.94
Daily Pivot Point S1: 53.86
Daily Pivot Point S2: 53.73
Daily Pivot Point S3: 53.61
Daily Pivot Point R1: 54.11
Daily Pivot Point R2: 54.23
Daily Pivot Point R3: 54.36
