- Early Monday action is seeing a continued rise in the US Dollar Index, lifting into the 97.00 major technical level during the Asian market session.
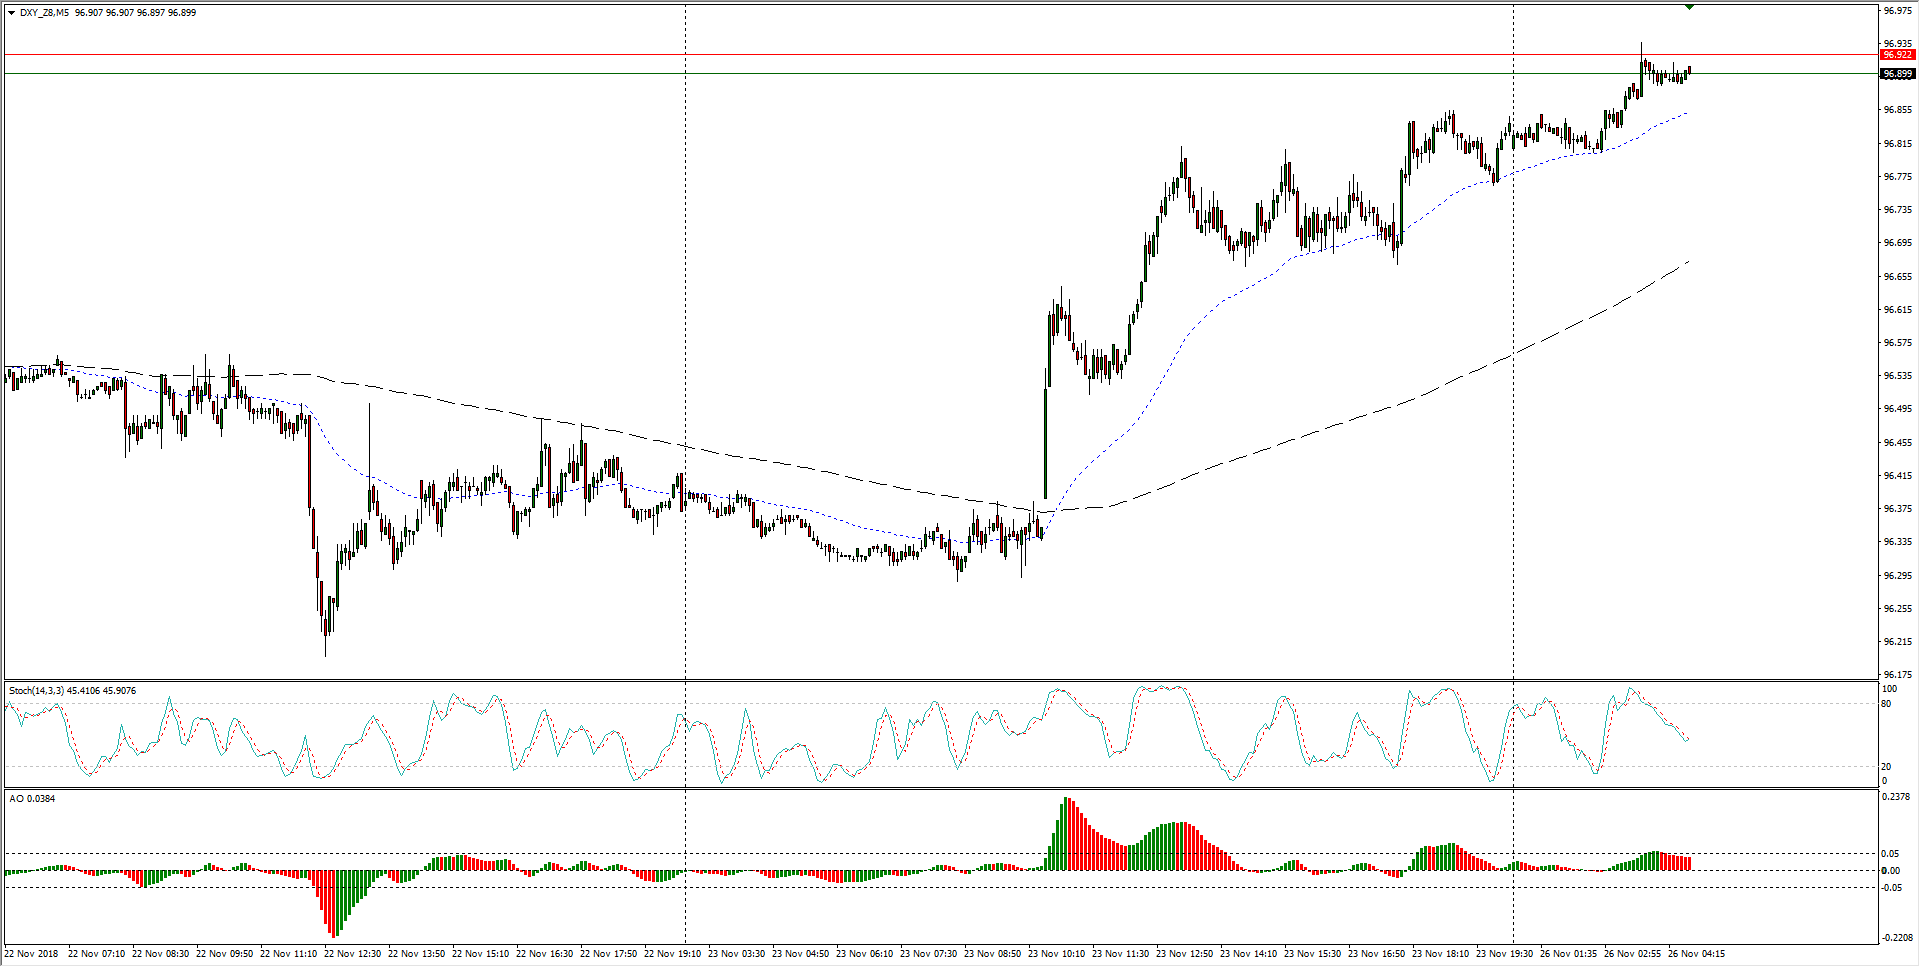
- With volumes on the thin side for the initial Monday markets, the DXY could struggle to stake a serious claim on 97.00 without help from the upcoming European market open.
DXY Chart, 5-Minute
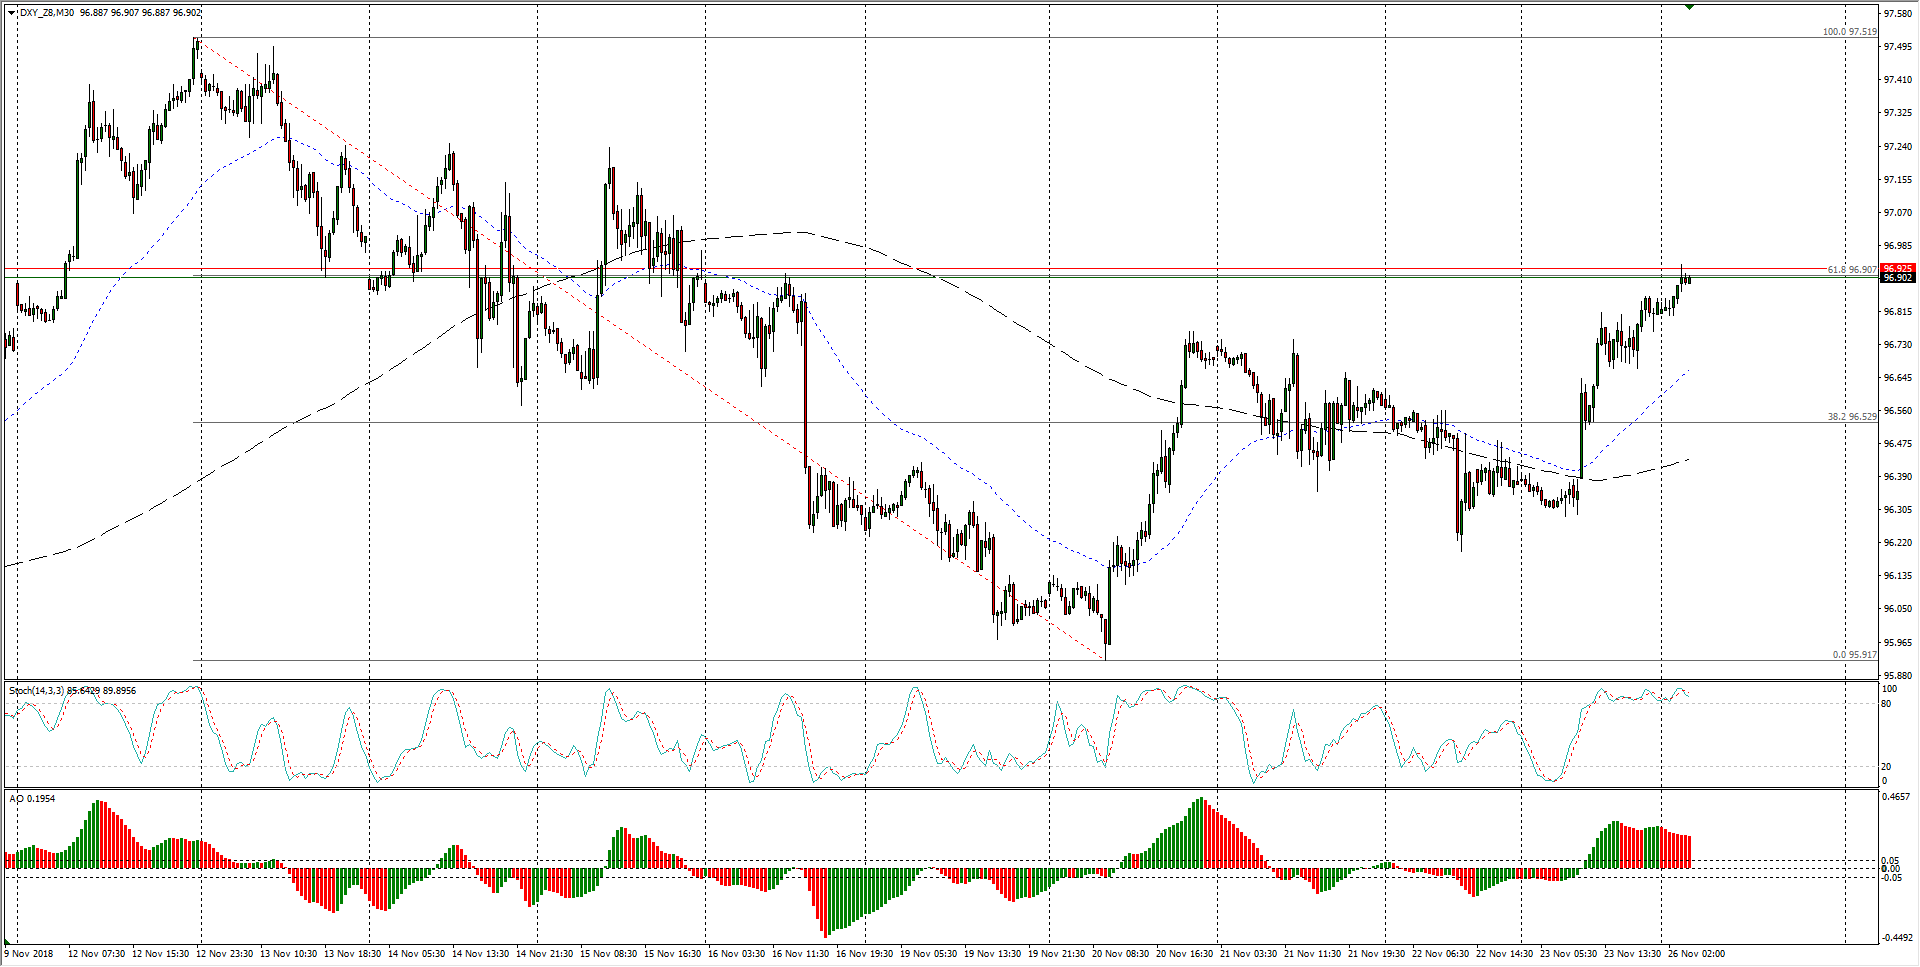
- Caution signs are getting thrown up on higher timeframes, with current price action running into a challenging zone, a key round figure and the 61.8% Fibonacci retracement level from the last two week’s high-low.
DXY Chart, 30-Minute
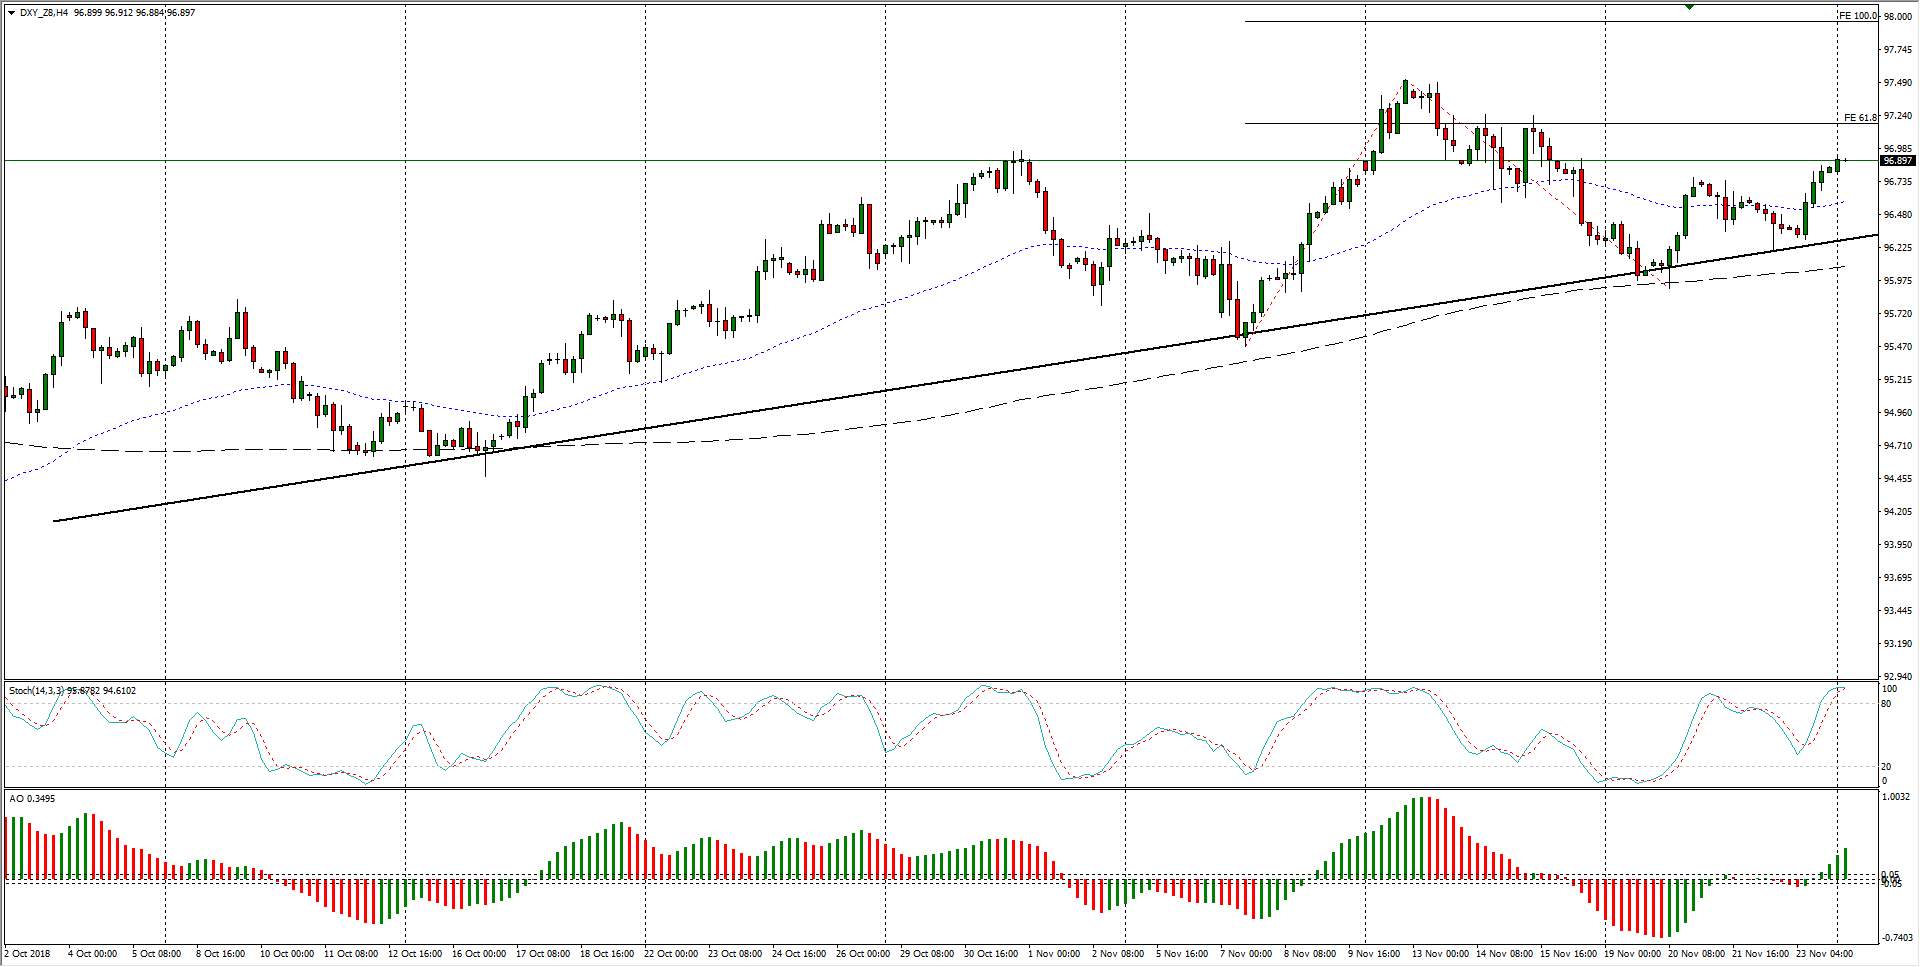
- The bullish technical stance continues on 4-Hour candles, and the past two months see the DXY getting bolstered by a clean rising trendline, while a 100.0% Fibonacci expansion level rests at the nearest round figure of 98.00, providing a handy target for long positions to aim at.
DXY Chart, 4-Hour
Dollar Index Spot
Overview:
Today Last Price: 97
Today Daily change: 3.0 pips
Today Daily change %: 0.0309%
Today Daily Open: 96.97
Trends:
Previous Daily SMA20: 96.73
Previous Daily SMA50: 95.87
Previous Daily SMA100: 95.49
Previous Daily SMA200: 93.72
Levels:
Previous Daily High: 96.98
Previous Daily Low: 96.4
Previous Weekly High: 96.98
Previous Weekly Low: 96.04
Previous Monthly High: 97.2
Previous Monthly Low: 94.79
Previous Daily Fibonacci 38.2%: 96.76
Previous Daily Fibonacci 61.8%: 96.62
Previous Daily Pivot Point S1: 96.59
Previous Daily Pivot Point S2: 96.2
Previous Daily Pivot Point S3: 96.01
Previous Daily Pivot Point R1: 97.17
Previous Daily Pivot Point R2: 97.36
Previous Daily Pivot Point R3: 97.75
