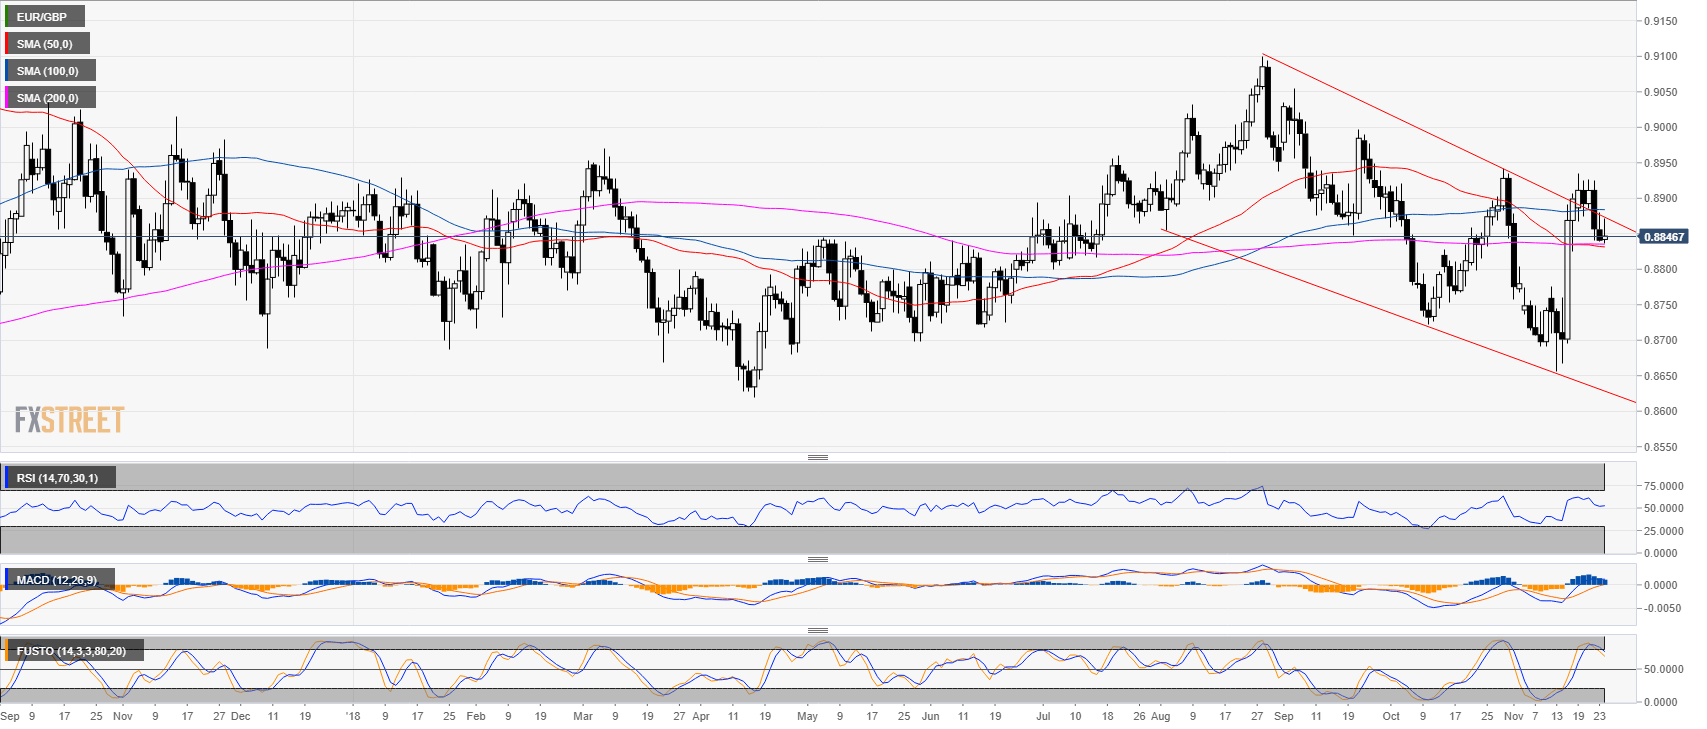
EUR/GBP daily chart
- EUR/GBP is trading just above its 50 and 200-day simple moving averages (SMAs).
- The market is trading inside Friday’s range rejecting the 100 SMA.
- Technical indicators are holding in positive territories.
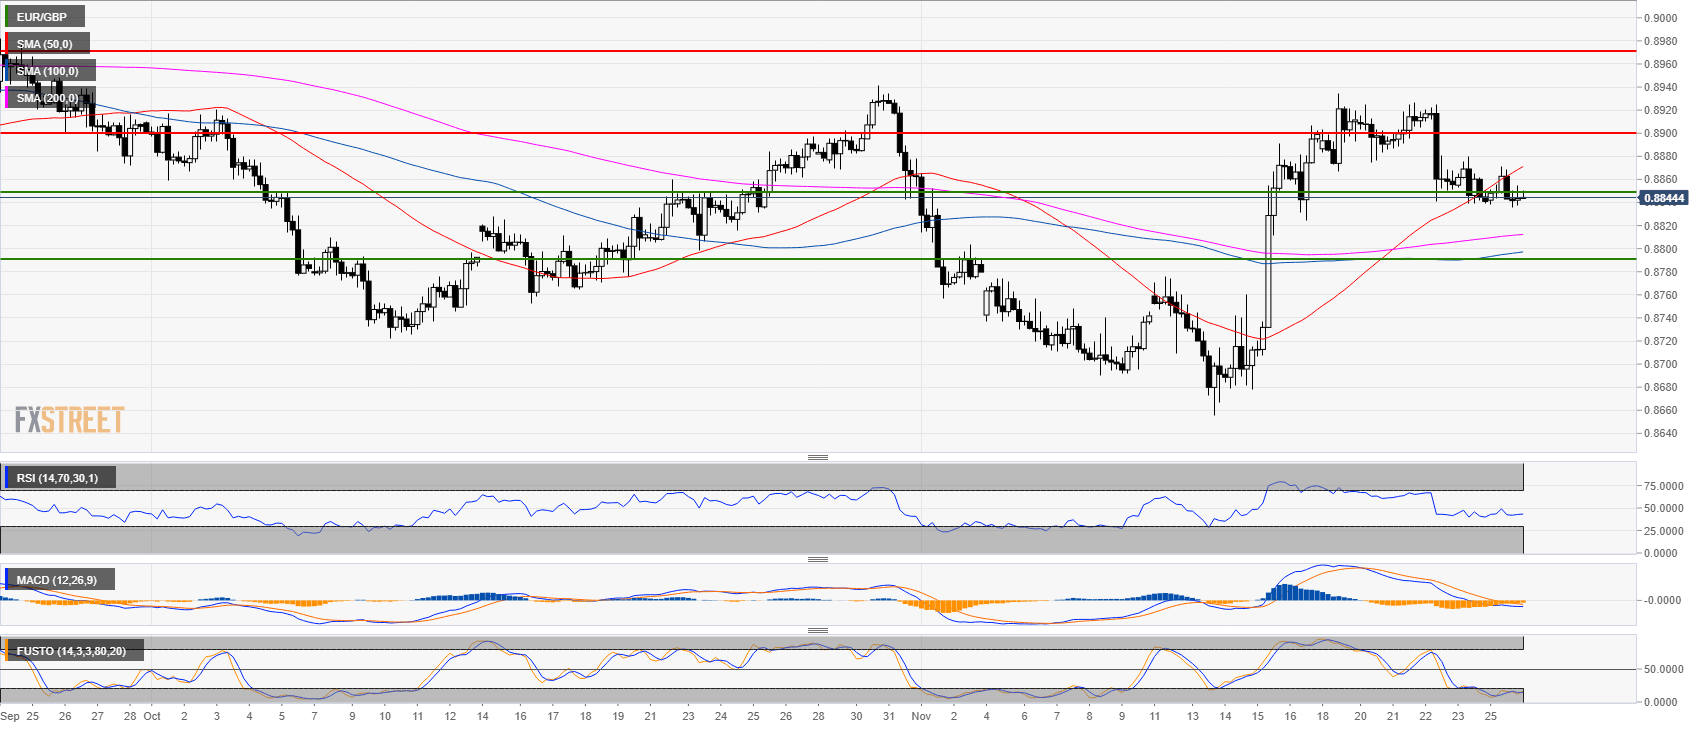
EUR/GBP 4-hour chart
- EUR/GBP is consolidating after the recent drop to the 0.8840 level.
- The market is fairly balanced and both bulls and bears have valid arguments.
- The market is creating a double bottom bull flag, giving buyers the opportunity to target 0.8900 figure. However, the market remains fragile and failure to hold 0.8840 level could lead to a drop to the 0.8790 level.
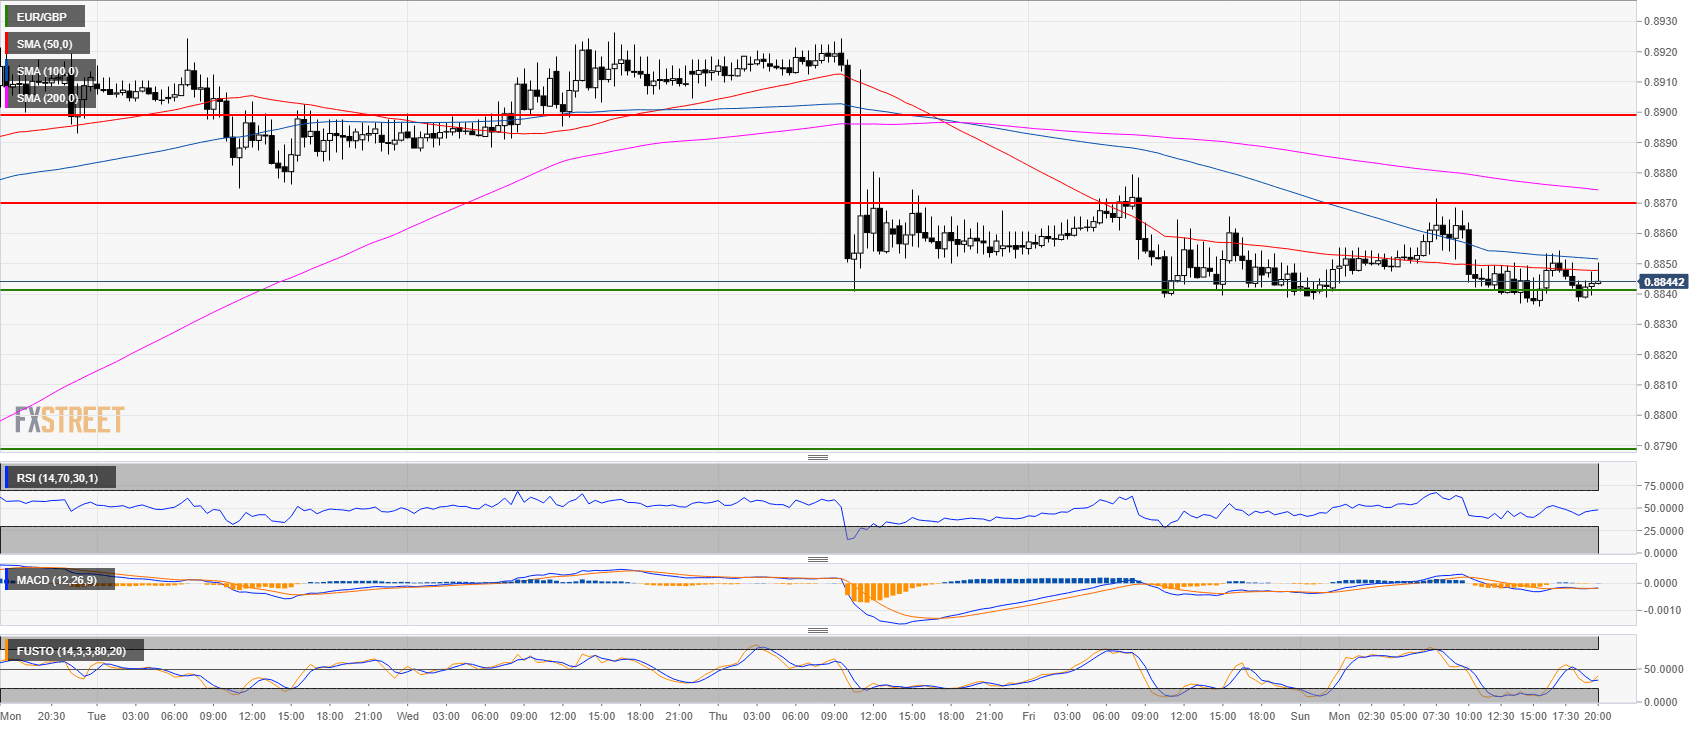
EUR/GBP 30-minute chart
- EUR/GBP is trading below its main SMAs.
- The first task for bulls is to recapture the 0.8870 level.
Additional key levels
EUR/GBP
Overview:
Today Last Price: 0.8846
Today Daily change: 5.0 pips
Today Daily change %: 0.0566%
Today Daily Open: 0.8841
Trends:
Previous Daily SMA20: 0.8809
Previous Daily SMA50: 0.8832
Previous Daily SMA100: 0.8884
Previous Daily SMA200: 0.8836
Levels:
Previous Daily High: 0.888
Previous Daily Low: 0.8839
Previous Weekly High: 0.8934
Previous Weekly Low: 0.8839
Previous Monthly High: 0.8942
Previous Monthly Low: 0.8722
Previous Daily Fibonacci 38.2%: 0.8854
Previous Daily Fibonacci 61.8%: 0.8864
Previous Daily Pivot Point S1: 0.8827
Previous Daily Pivot Point S2: 0.8812
Previous Daily Pivot Point S3: 0.8786
Previous Daily Pivot Point R1: 0.8867
Previous Daily Pivot Point R2: 0.8894
Previous Daily Pivot Point R3: 0.8908
