- The USD/INR gapped lower on Monday and hit a three-month low of 70.31, possibly in response to oil’s 8 percent slide on Friday.
- The dollar bulls may defend the 38.2 percent Fib level of 70.19 in the short-term, as the 14-day relative strength index (RSI) is reporting oversold conditions for the first time since January.
- More importantly, oil price sell-off is looking overdone and a corrective bounce could be seen in the next few days.
- As a result, USD/INR could test the downward sloping 10-day exponential moving average (EMA) in the short-term. At press time, the 10-day EMA is seen at 71.29. A failure to take out the 10-day EMA will likely recharge engines for a sustained break below the psychological support of 70.00. A close above the 10-day EMA would neutralize the immediate bearish outlook and could yield consolidation.
Daily chart
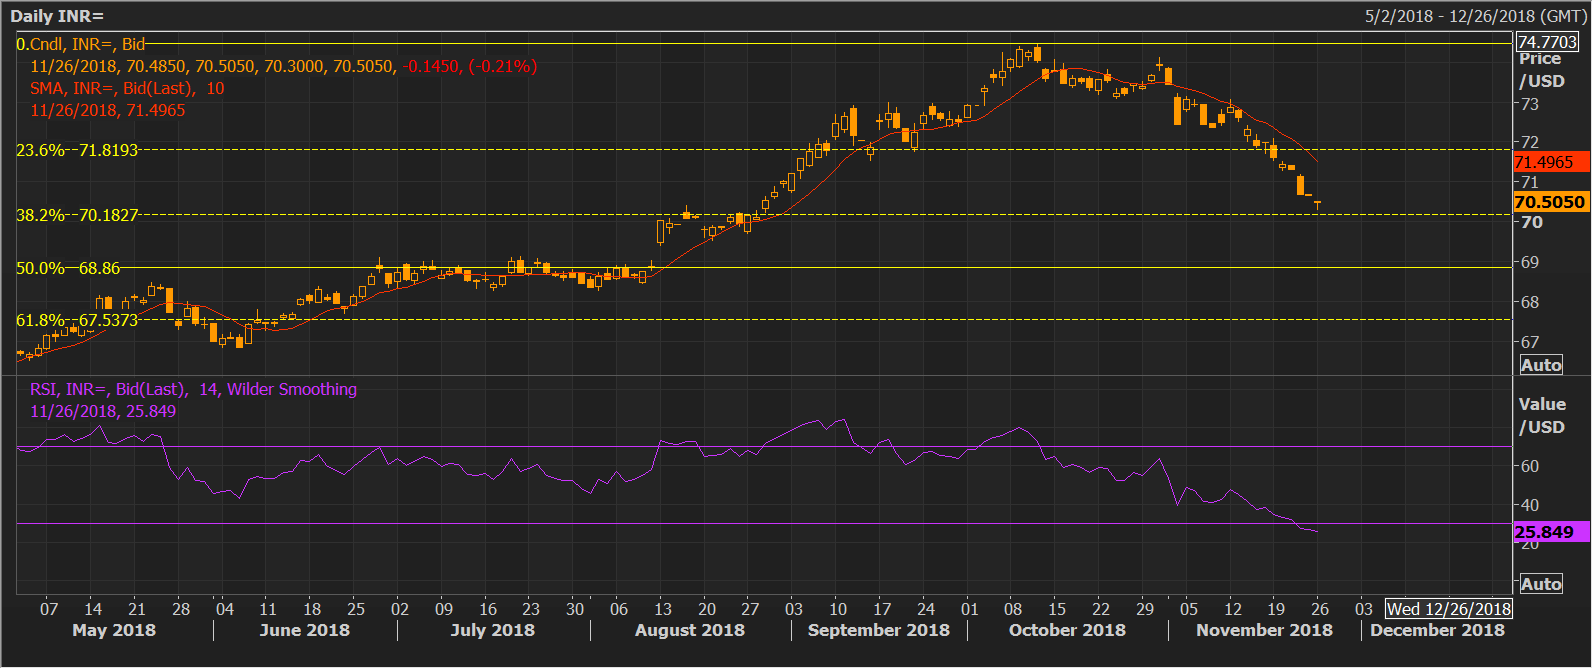
Trend: Corrective bounce likely
USD/INR
Overview:
Today Last Price: 70.4563
Today Daily change: -3.9e+2 pips
Today Daily change %: -0.0549%
Today Daily Open: 70.495
Trends:
Previous Daily SMA20: 72.3641
Previous Daily SMA50: 72.8907
Previous Daily SMA100: 71.3283
Previous Daily SMA200: 68.9012
Levels:
Previous Daily High: 70.709
Previous Daily Low: 70.495
Previous Weekly High: 72.102
Previous Weekly Low: 70.495
Previous Monthly High: 74.504
Previous Monthly Low: 72.525
Previous Daily Fibonacci 38.2%: 70.5767
Previous Daily Fibonacci 61.8%: 70.6273
Previous Daily Pivot Point S1: 70.4237
Previous Daily Pivot Point S2: 70.3523
Previous Daily Pivot Point S3: 70.2097
Previous Daily Pivot Point R1: 70.6377
Previous Daily Pivot Point R2: 70.7803
Previous Daily Pivot Point R3: 70.8517
