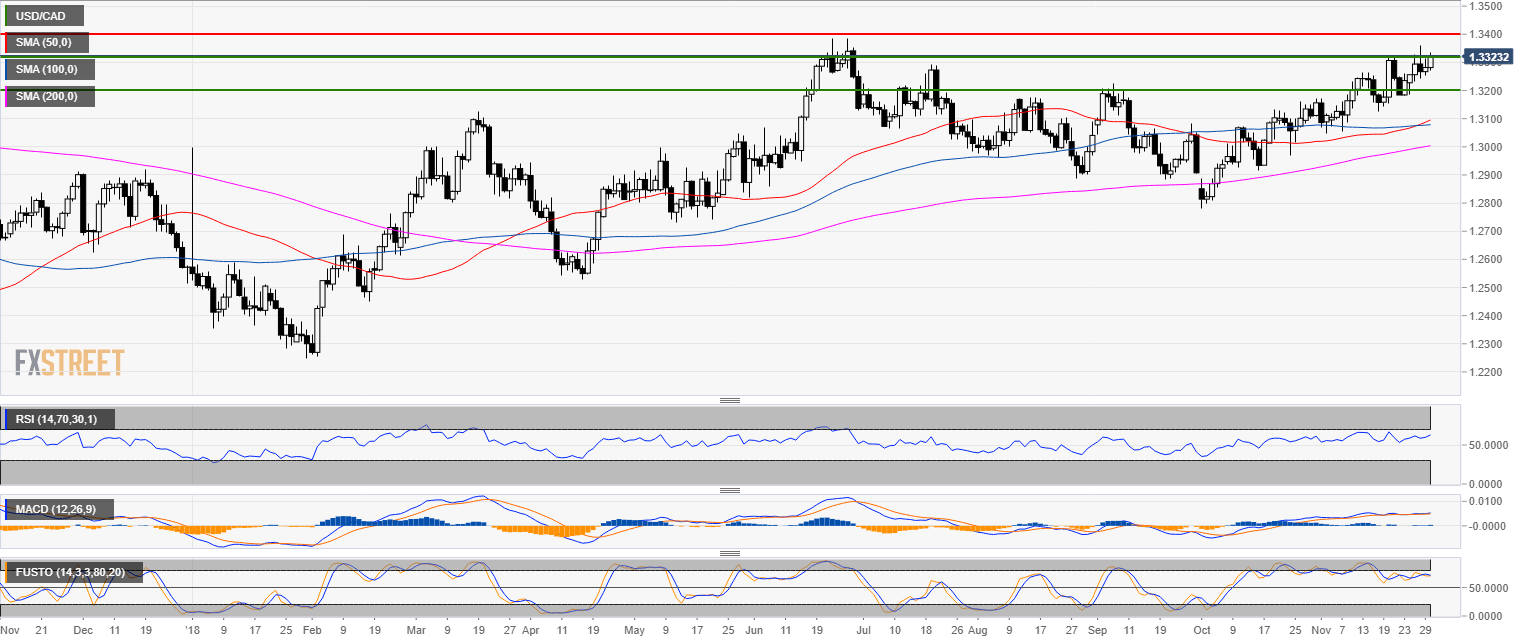
USD/CAD daily chart
- USD/CAD is trading in a bull trend above the 50, 100 and 200-period simple moving averages (SMAs).
- USD/CAD is challenging the November highs as bulls are also aiming at the June’s top.
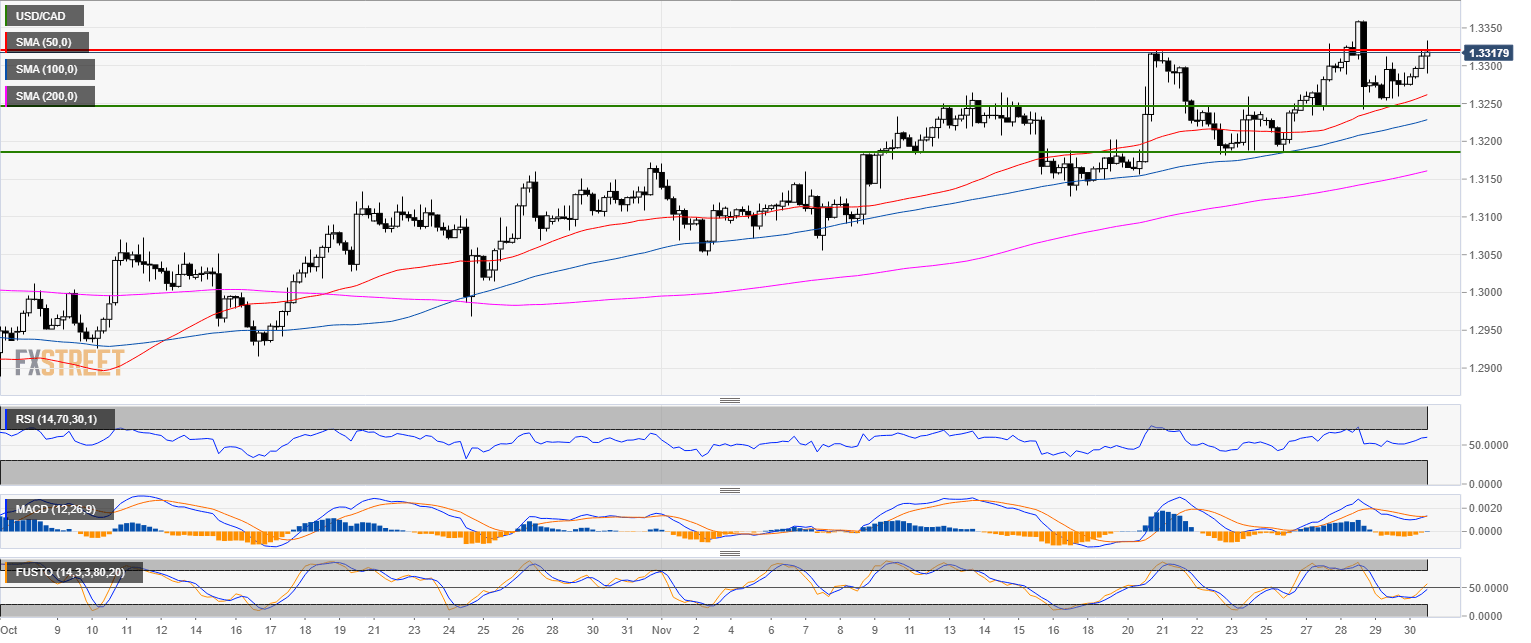
USD/CAD 4-hour chart
- USD/CAD bulls are knocking at the 1.3320 resistance as technical indicators remain bullishly configured.
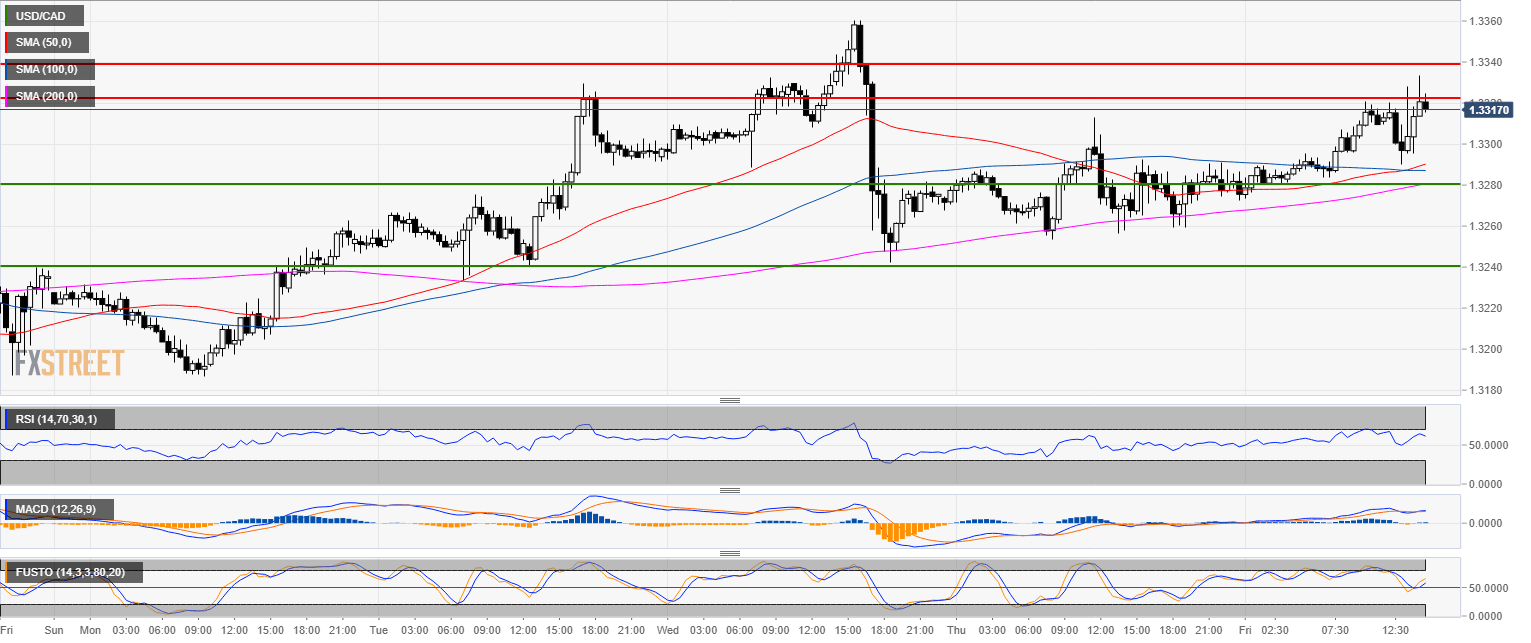
USD/CAD 30-minute chart
- There is currently no acceptance of price above 1.3320 suggesting that USD/CAD might take a breather on Friday before resuming the uptrend.
Additional key levels
USD/CAD
Overview:
Today Last Price: 1.3321
Today Daily change: 39 pips
Today Daily change %: 0.294%
Today Daily Open: 1.3282
Trends:
Previous Daily SMA20: 1.3207
Previous Daily SMA50: 1.3087
Previous Daily SMA100: 1.3077
Previous Daily SMA200: 1.2997
Levels:
Previous Daily High: 1.3313
Previous Daily Low: 1.3254
Previous Weekly High: 1.332
Previous Weekly Low: 1.3142
Previous Monthly High: 1.3172
Previous Monthly Low: 1.2783
Previous Daily Fibonacci 38.2%: 1.329
Previous Daily Fibonacci 61.8%: 1.3276
Previous Daily Pivot Point S1: 1.3253
Previous Daily Pivot Point S2: 1.3223
Previous Daily Pivot Point S3: 1.3193
Previous Daily Pivot Point R1: 1.3312
Previous Daily Pivot Point R2: 1.3342
Previous Daily Pivot Point R3: 1.3371
