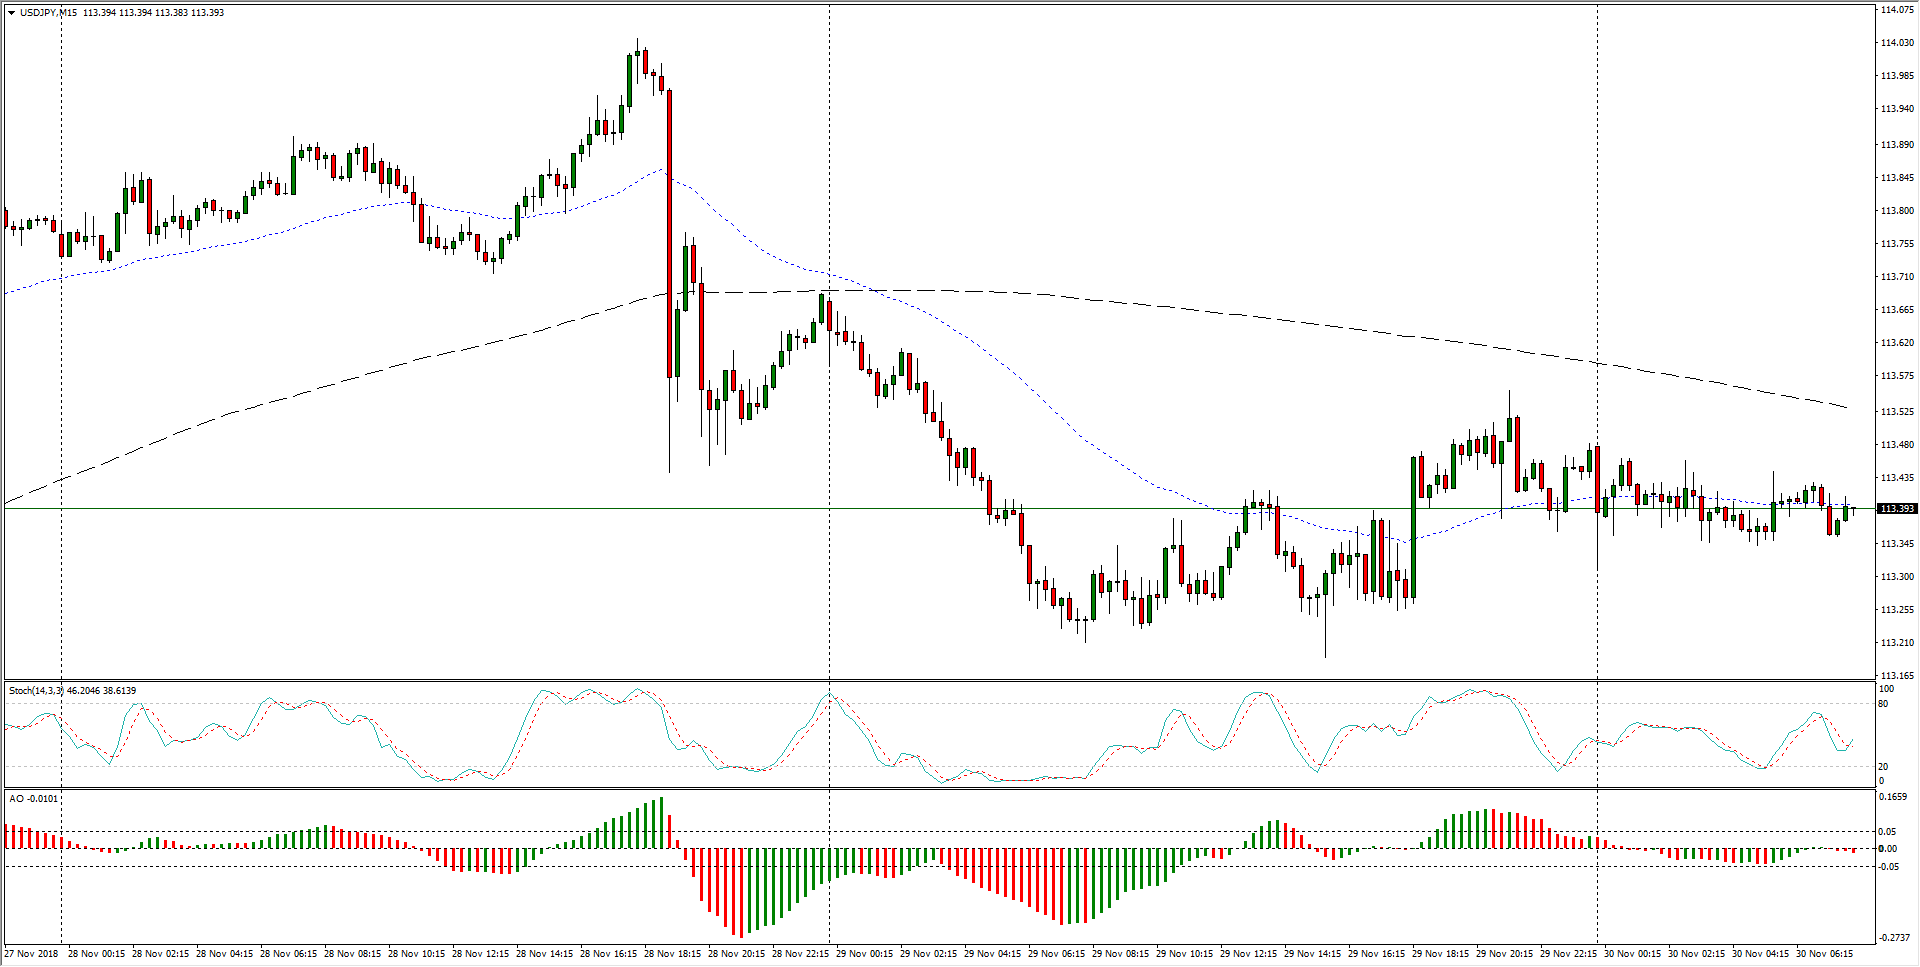
- USD/JPY remains tight with 1113.40 through Friday’s early session, stuck in a tight range within Thursday’s high/low spread.
USD/JPY, 15-Minute
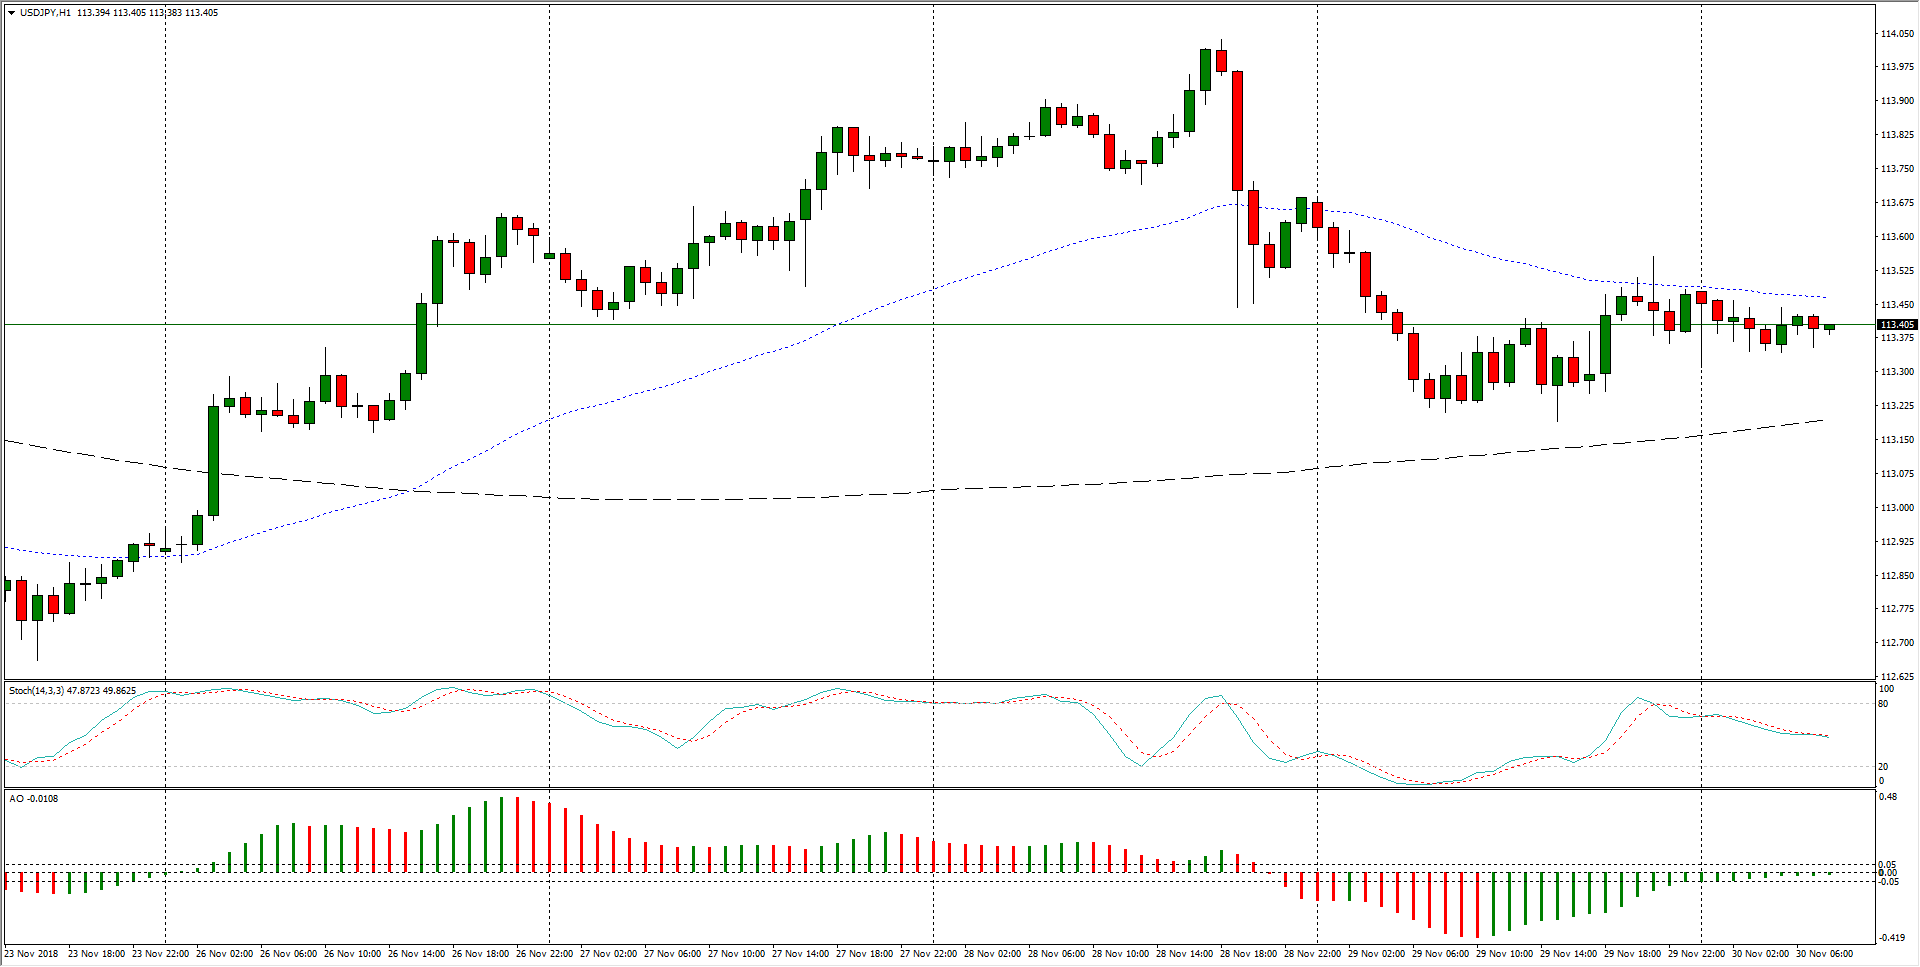
- Hourly candles show the pair caught in a non-directional zone, constrained within the 50-hour and 200-hour moving averages as the pair goes trendless in the near-term.
USD/JPY, 1-Hour
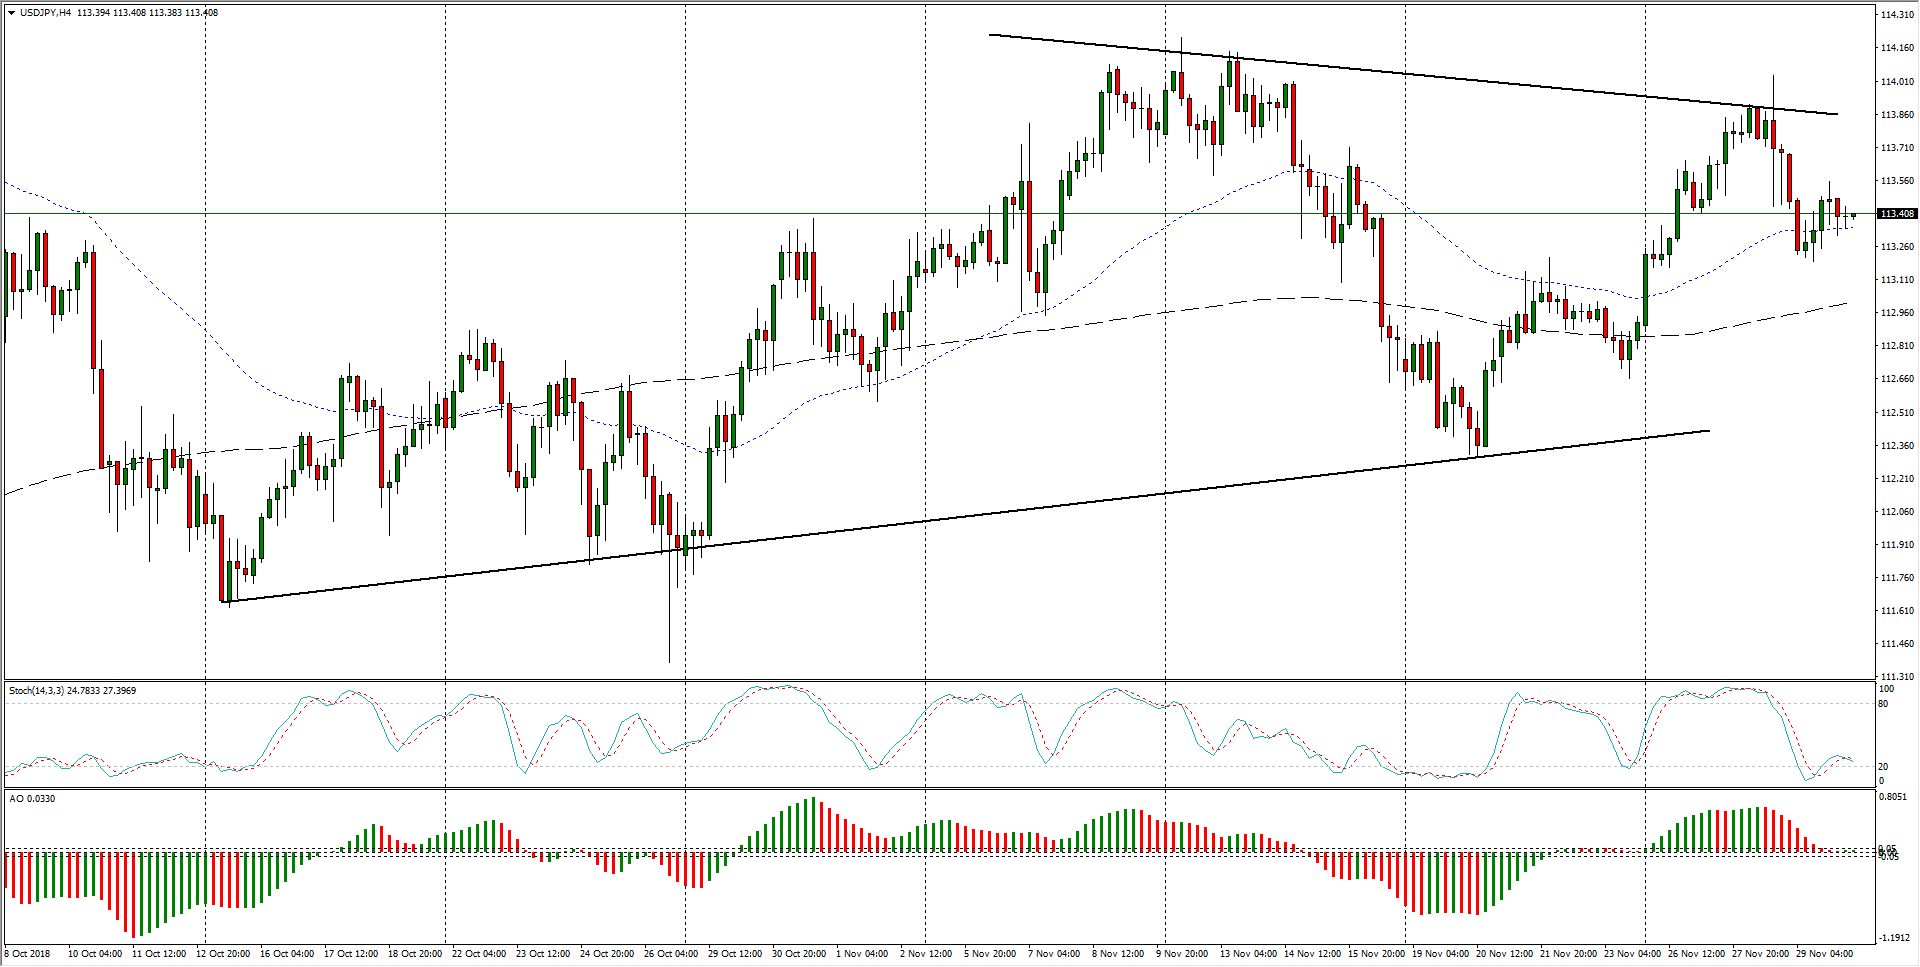
- USD/JPY has been slowly tightening for two months, caught between higher lows and slightly lower highs from 114.00 to 112.50, and the challenge for markets will be to successfully establish a break-and-retest of either direction before setting off on a new trend.
USD/JPY, 4-Hour
USD/JPY
Overview:
Today Last Price: 113.38
Today Daily change: -1.0 pips
Today Daily change %: -0.00882%
Today Daily Open: 113.39
Trends:
Previous Daily SMA20: 113.36
Previous Daily SMA50: 113.05
Previous Daily SMA100: 112.22
Previous Daily SMA200: 110.4
Levels:
Previous Daily High: 113.69
Previous Daily Low: 113.18
Previous Weekly High: 113.24
Previous Weekly Low: 112.3
Previous Monthly High: 114.56
Previous Monthly Low: 111.38
Previous Daily Fibonacci 38.2%: 113.37
Previous Daily Fibonacci 61.8%: 113.5
Previous Daily Pivot Point S1: 113.15
Previous Daily Pivot Point S2: 112.91
Previous Daily Pivot Point S3: 112.64
Previous Daily Pivot Point R1: 113.66
Previous Daily Pivot Point R2: 113.93
Previous Daily Pivot Point R3: 114.17
