- The US-China trade truce has put a bid under riskier assets, including oil prices.
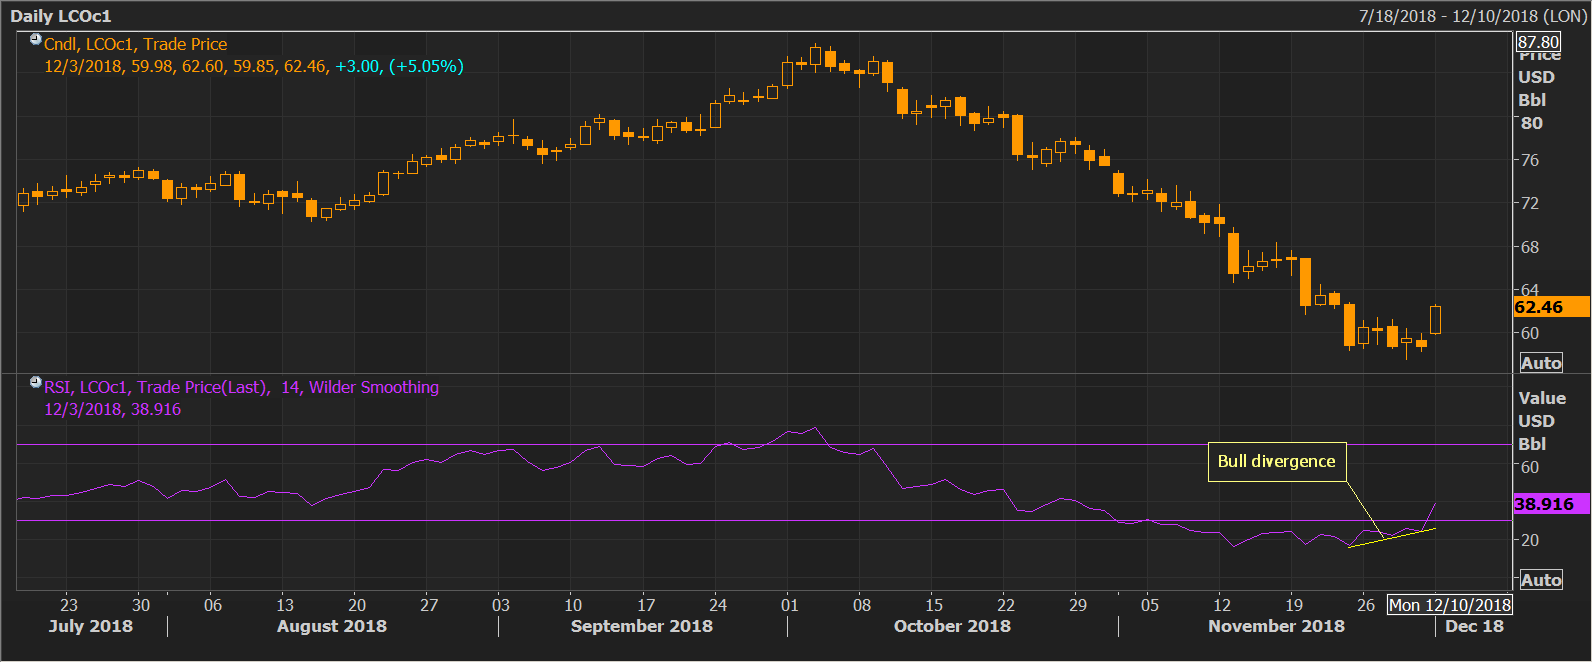
- Brent is reporting 4 percent gains at press time. Notably, the rally has confirmed a bullish divergence of the 14-day relative strength index (RSI). Simply put, the sell-off from the October high of $86.71 likely ended at a low of $57.53 last week and the bulls have regained control.
- Brent could test the immediate resistance of $64.69 (Nov. 13 low) in the short-term.
- The short-term bullish view would be invalidated if prices fail to hold above the descending 10-day simple moving average (SMA), currently lined up at $60.86.
Daily Chart
Trend: Bullish
Brent Oil
Overview:
Today Last Price: 62.32
Today Daily change: 3.2e+2 pips
Today Daily change %: 5.38%
Today Daily Open: 59.14
Trends:
Previous Daily SMA20: 63.65
Previous Daily SMA50: 72.24
Previous Daily SMA100: 74.81
Previous Daily SMA200: 75.09
Levels:
Previous Daily High: 60.41
Previous Daily Low: 58.03
Previous Weekly High: 61.5
Previous Weekly Low: 57.48
Previous Monthly High: 74.94
Previous Monthly Low: 57.48
Previous Daily Fibonacci 38.2%: 58.94
Previous Daily Fibonacci 61.8%: 59.5
Previous Daily Pivot Point S1: 57.98
Previous Daily Pivot Point S2: 56.81
Previous Daily Pivot Point S3: 55.59
Previous Daily Pivot Point R1: 60.36
Previous Daily Pivot Point R2: 61.58
Previous Daily Pivot Point R3: 62.74
