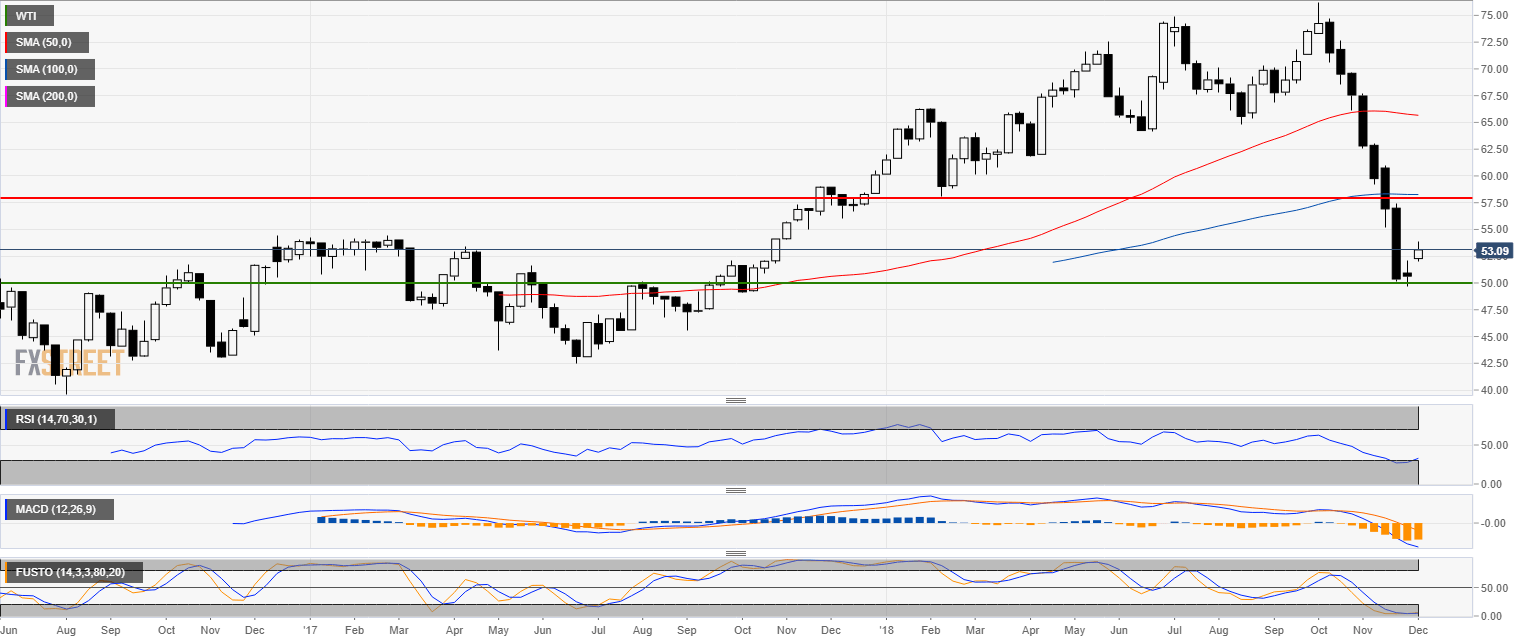
Oil weekly chart
- Crude oil WTI strongly rebounded from the 50.00 level.
- Crude oil WTI reached 53.00 as forecast.
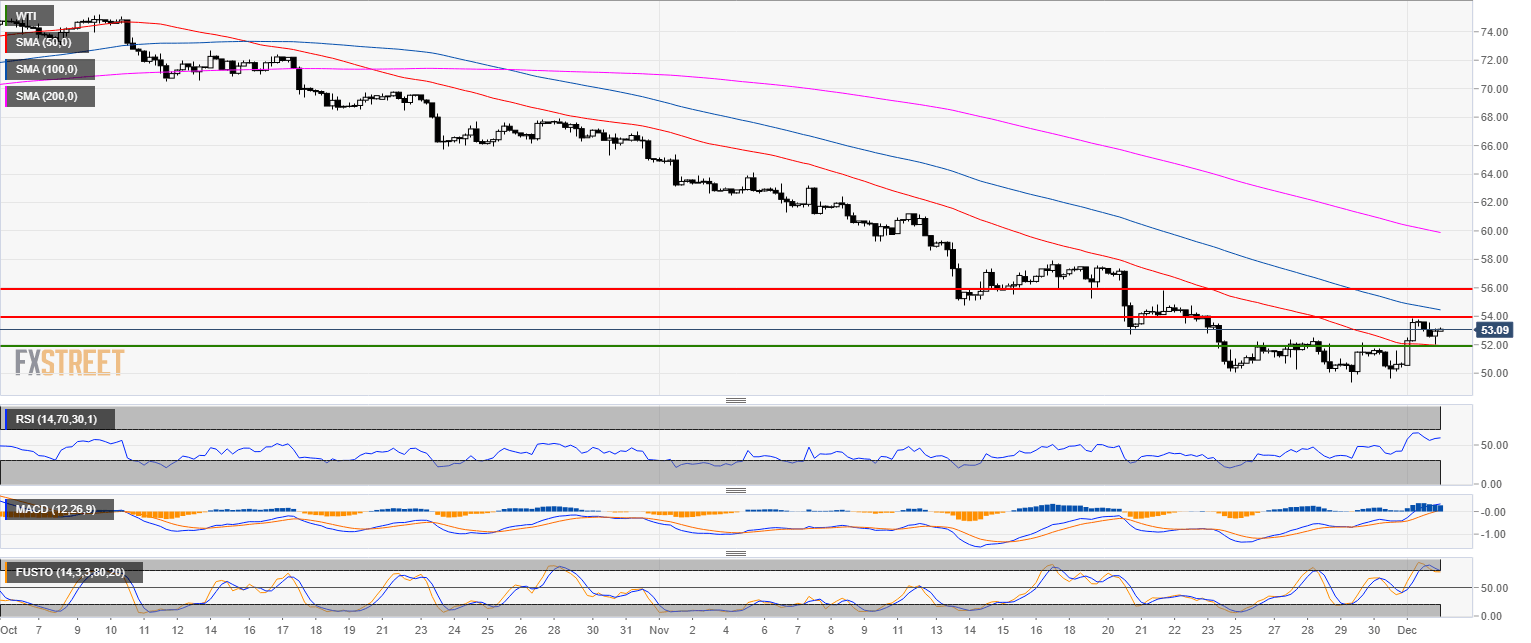
Oil 4-hour chart
- Oil found support at the 50 SMA. The level to beat for bulls is 54.00.
- Key resistance to the upside should be 56.00 and 52.00 is the support to break for bears.
Oil 30-minute chart
- On lower time-frames, it is more likely that oil will correct lower to 52.00 and possibly to 50.50.
- Alternatively, in the absence of a bearish pullback, a break of the 54.00 should open the gates to 56.00.

Additional key levels
WTI
Overview:
Today Last Price: 53.08
Today Daily change: 80 pips
Today Daily change %: 1.53%
Today Daily Open: 52.28
Trends:
Previous Daily SMA20: 54.52
Previous Daily SMA50: 62.7
Previous Daily SMA100: 66.05
Previous Daily SMA200: 67.52
Levels:
Previous Daily High: 52.34
Previous Daily Low: 52.01
Previous Weekly High: 52.13
Previous Weekly Low: 49.64
Previous Monthly High: 63.92
Previous Monthly Low: 49.64
Previous Daily Fibonacci 38.2%: 52.21
Previous Daily Fibonacci 61.8%: 52.14
Previous Daily Pivot Point S1: 52.08
Previous Daily Pivot Point S2: 51.88
Previous Daily Pivot Point S3: 51.75
Previous Daily Pivot Point R1: 52.41
Previous Daily Pivot Point R2: 52.54
Previous Daily Pivot Point R3: 52.74
