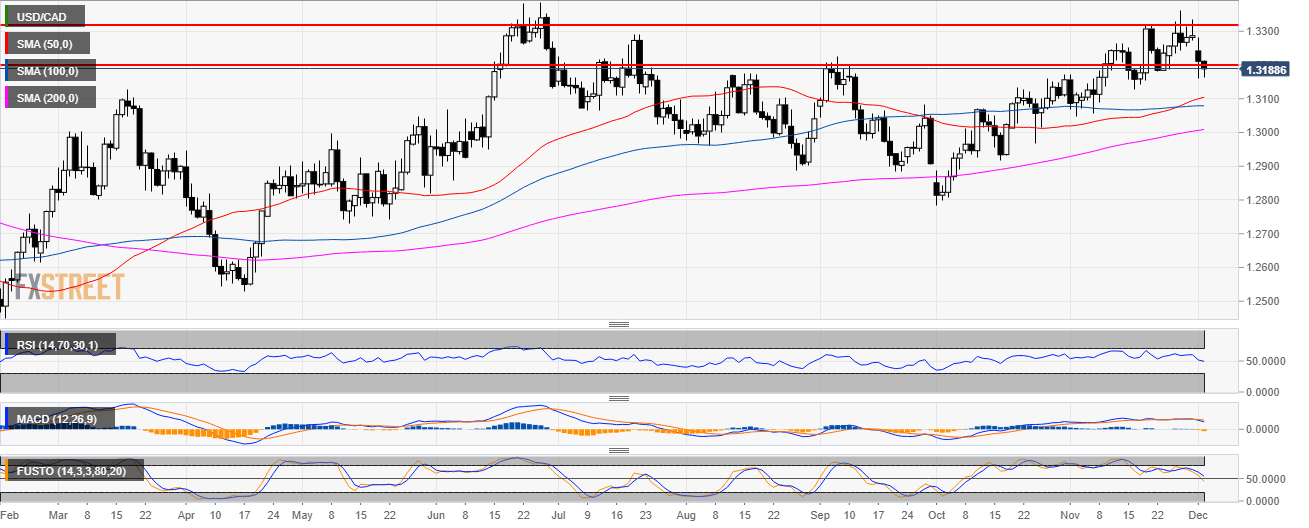
USD/CAD daily chart
- USD/CAD is trading in a bull trend above the 200-day simple moving average (SMA).
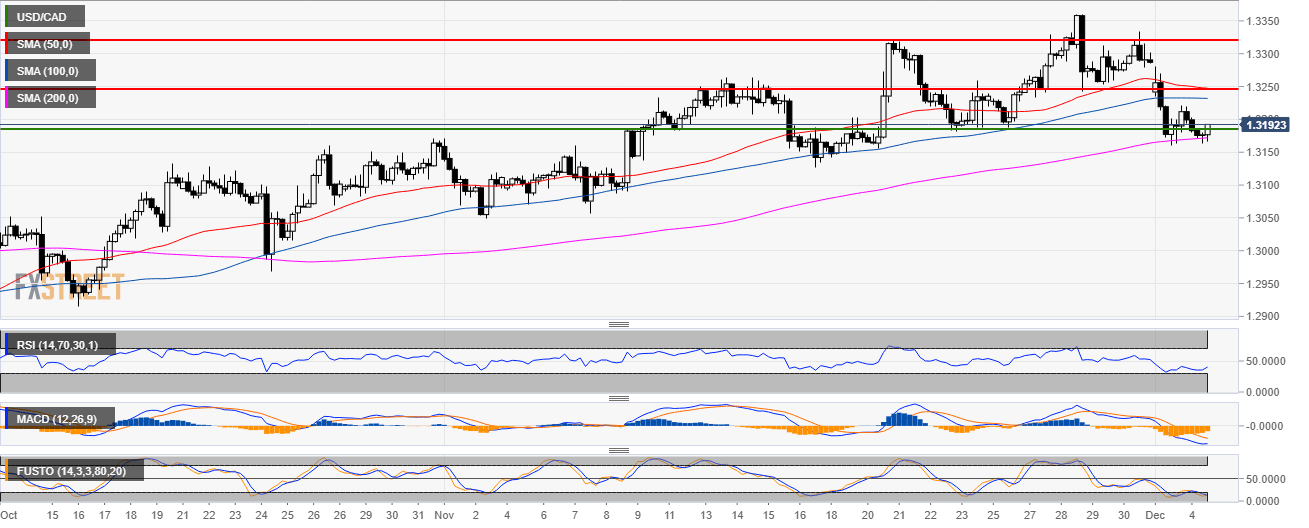
USD/CAD 4-hour chart
- USD/CAD found some support at the 200 SMA.
USD/CAD 30-minute chart
- On smaller time-frames, the 1.3160 support is holding.
- Bulls are targeting the 1.3240 level.

Additional key levels
USD/CAD
Overview:
Today Last Price: 1.3195
Today Daily change: -16 pips
Today Daily change %: -0.121%
Today Daily Open: 1.3211
Trends:
Previous Daily SMA20: 1.3221
Previous Daily SMA50: 1.31
Previous Daily SMA100: 1.3079
Previous Daily SMA200: 1.3003
Levels:
Previous Daily High: 1.328
Previous Daily Low: 1.316
Previous Weekly High: 1.336
Previous Weekly Low: 1.3187
Previous Monthly High: 1.336
Previous Monthly Low: 1.3048
Previous Daily Fibonacci 38.2%: 1.3206
Previous Daily Fibonacci 61.8%: 1.3234
Previous Daily Pivot Point S1: 1.3154
Previous Daily Pivot Point S2: 1.3096
Previous Daily Pivot Point S3: 1.3033
Previous Daily Pivot Point R1: 1.3275
Previous Daily Pivot Point R2: 1.3338
Previous Daily Pivot Point R3: 1.3396
