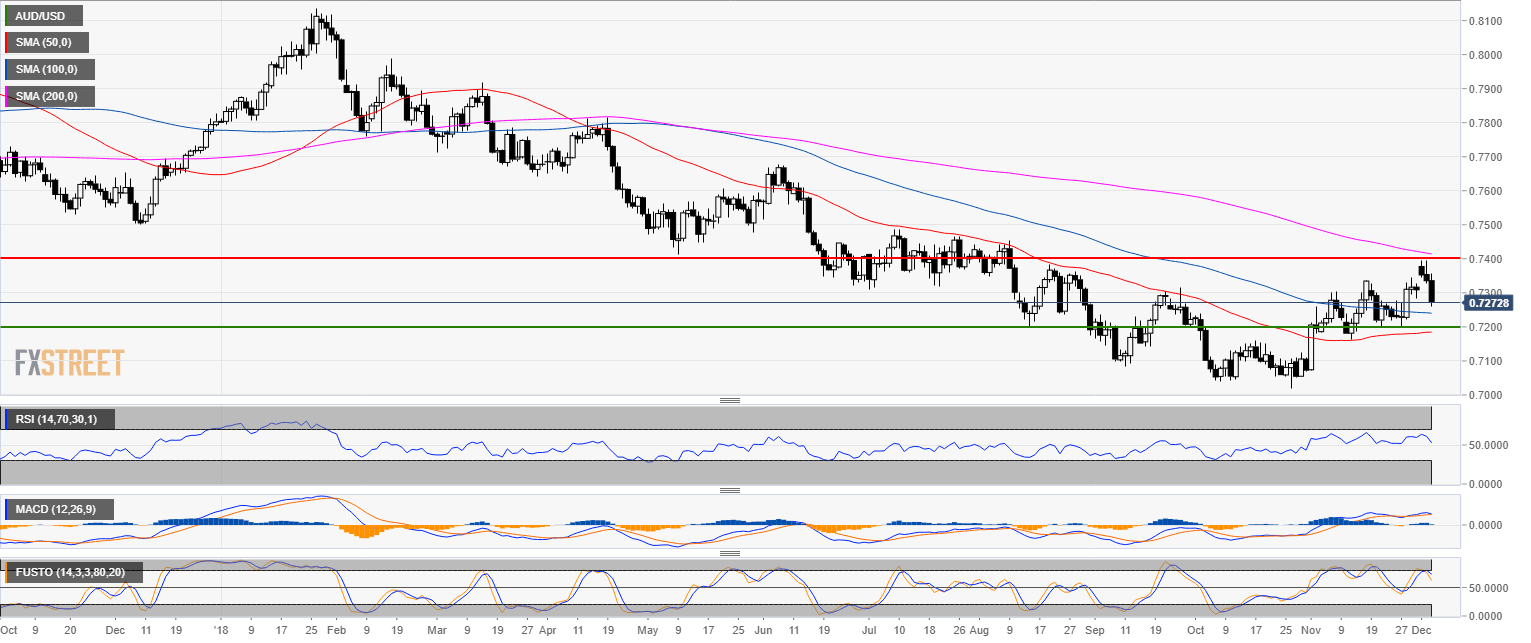
AUD/USD daily chart
- AUD/USD is trading in a bear trend below the 200-day simple moving average (SMA) as the market is dropping below the 0.7400 and 0.7300 figures.
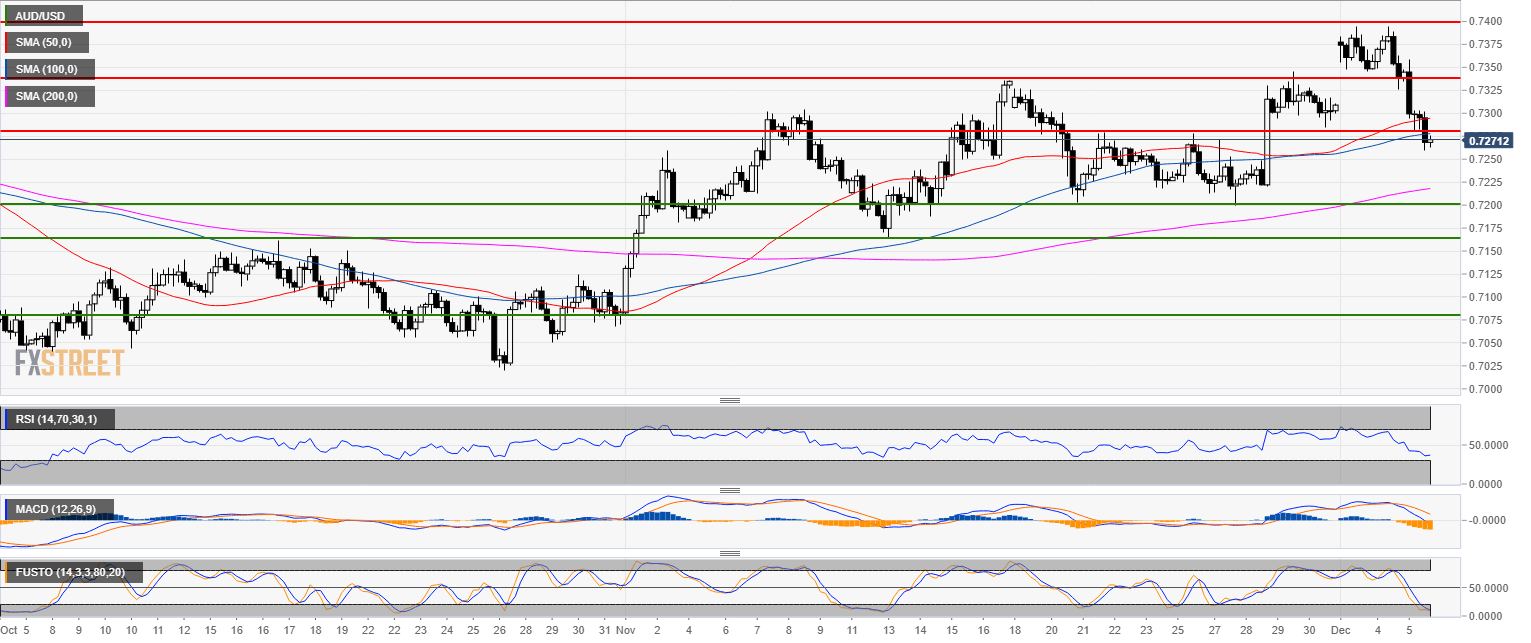
AUD/USD 4-hour chart
- The Aussie broke below the 0.7300 as well as the 50 and 100 SMAs suggesting potential weakness in the coming sessions.
- Technical indicators have also turned bearish.
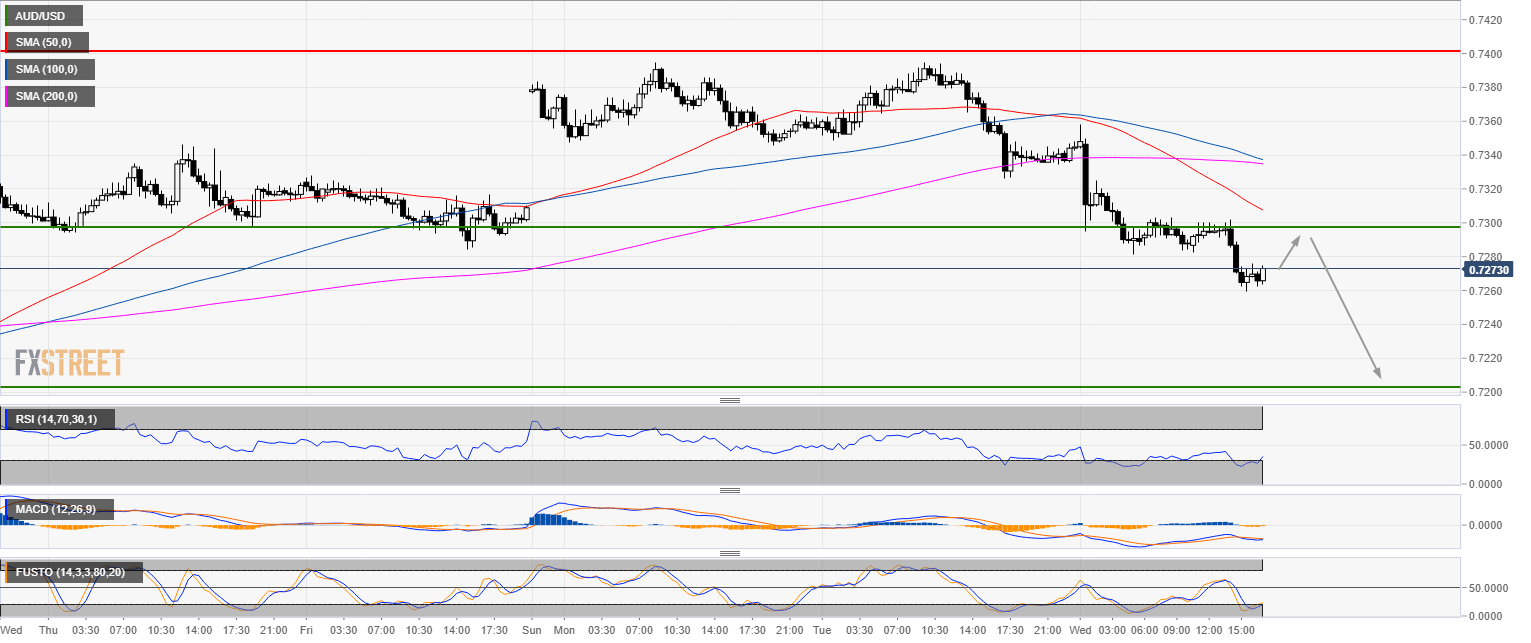
AUD/USD 30-minute chart
- On lower time-frames, the market is set to retest 0.7300 and then potentially drop to 0.7200 figure.
Additional key levels
AUD/USD
Overview:
Today Last Price: 0.7269
Today Daily change: -67 pips
Today Daily change %: -0.913%
Today Daily Open: 0.7336
Trends:
Previous Daily SMA20: 0.7267
Previous Daily SMA50: 0.7184
Previous Daily SMA100: 0.7242
Previous Daily SMA200: 0.7419
Levels:
Previous Daily High: 0.7394
Previous Daily Low: 0.7326
Previous Weekly High: 0.7345
Previous Weekly Low: 0.7199
Previous Monthly High: 0.7345
Previous Monthly Low: 0.7072
Previous Daily Fibonacci 38.2%: 0.7352
Previous Daily Fibonacci 61.8%: 0.7368
Previous Daily Pivot Point S1: 0.731
Previous Daily Pivot Point S2: 0.7284
Previous Daily Pivot Point S3: 0.7242
Previous Daily Pivot Point R1: 0.7378
Previous Daily Pivot Point R2: 0.742
Previous Daily Pivot Point R3: 0.7446
