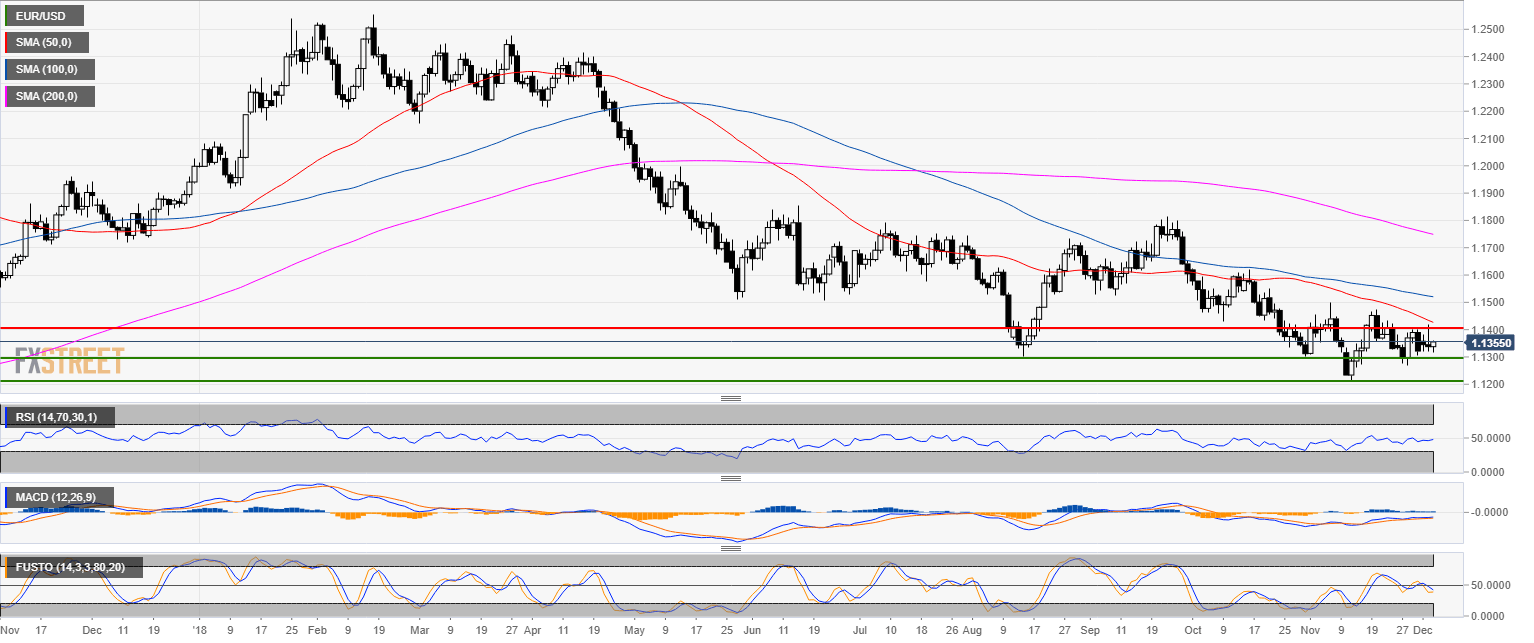
EUR/USD daily chart
- EUR/USD is trading in a bear trend below the 200-day simple moving average (SMA).
- On Tuesday bears rejected the 1.1400 level but bulls are once again finding support just above 1.1300 figure.
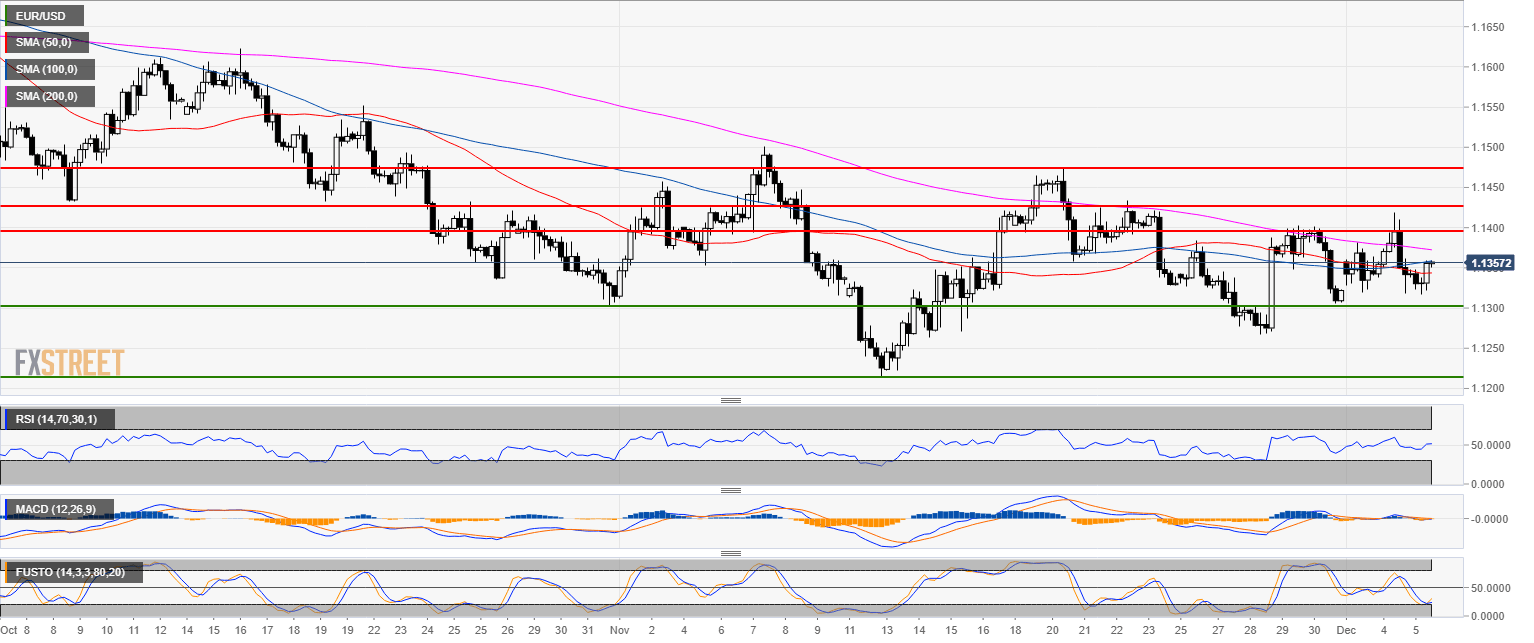
EUR/USD 4-hour chart
- EUR/USD bulls need to break above the 100 SMA.
- The 50 SMA is expected to hold prices for further upside.
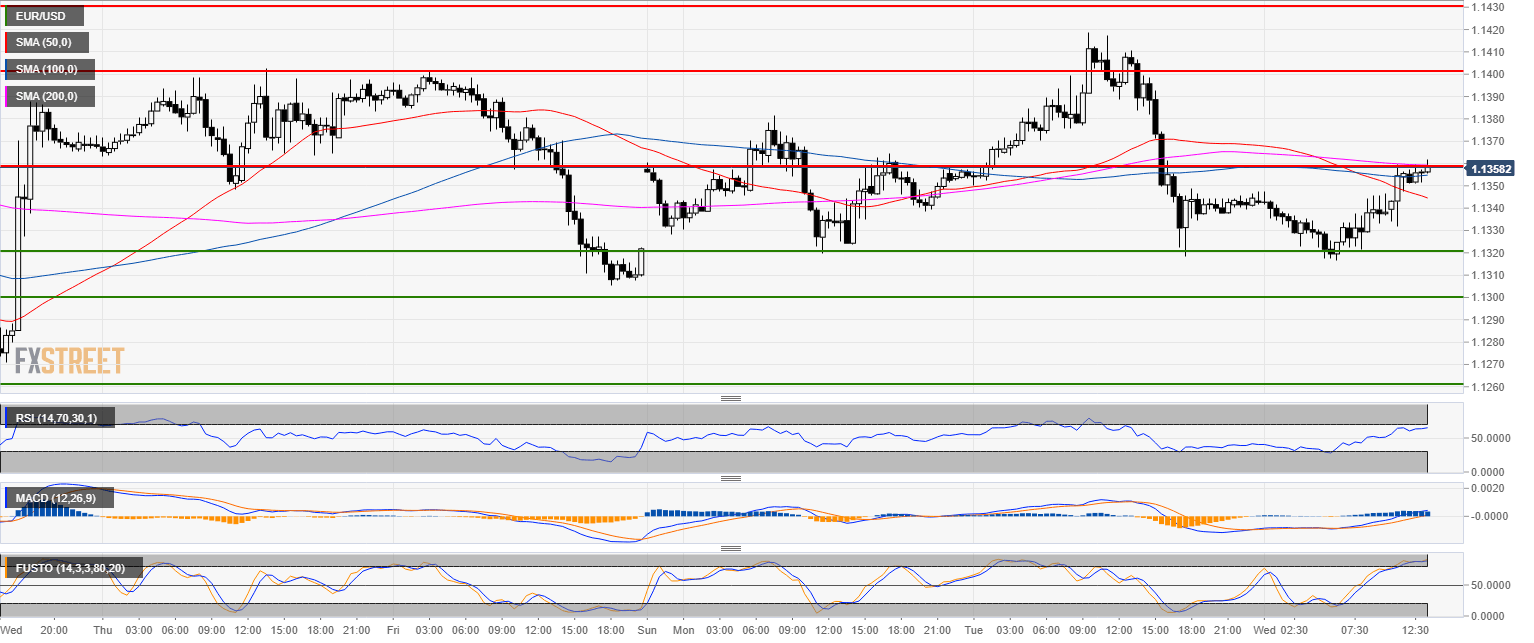
EUR/USD 30-minute chart
- 1.1360 and the 200 SMA is the level to beat for bulls.
- The target is 1.1400 in the short-term.
Additional key levels
EUR/USD
Overview:
Today Last Price: 1.1356
Today Daily change: 18 pips
Today Daily change %: 0.159%
Today Daily Open: 1.1338
Trends:
Previous Daily SMA20: 1.1353
Previous Daily SMA50: 1.1434
Previous Daily SMA100: 1.1523
Previous Daily SMA200: 1.1755
Levels:
Previous Daily High: 1.1419
Previous Daily Low: 1.1318
Previous Weekly High: 1.1402
Previous Weekly Low: 1.1267
Previous Monthly High: 1.15
Previous Monthly Low: 1.1216
Previous Daily Fibonacci 38.2%: 1.1357
Previous Daily Fibonacci 61.8%: 1.138
Previous Daily Pivot Point S1: 1.1298
Previous Daily Pivot Point S2: 1.1258
Previous Daily Pivot Point S3: 1.1197
Previous Daily Pivot Point R1: 1.1398
Previous Daily Pivot Point R2: 1.1459
Previous Daily Pivot Point R3: 1.1499
