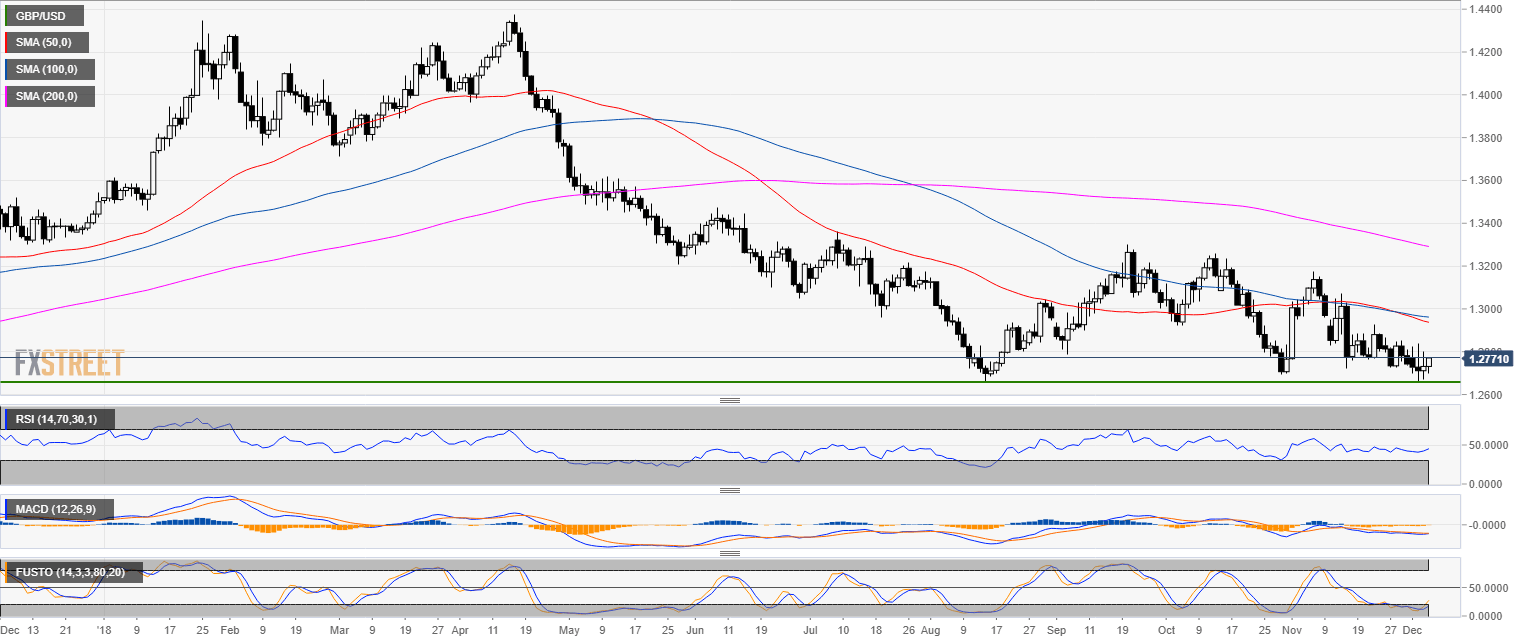
GBP/USD daily chart
- GBP/USD is in a bear trend below the 200-day simple moving average (SMA).
- GBP/USD is trading near 4-month’s lows.
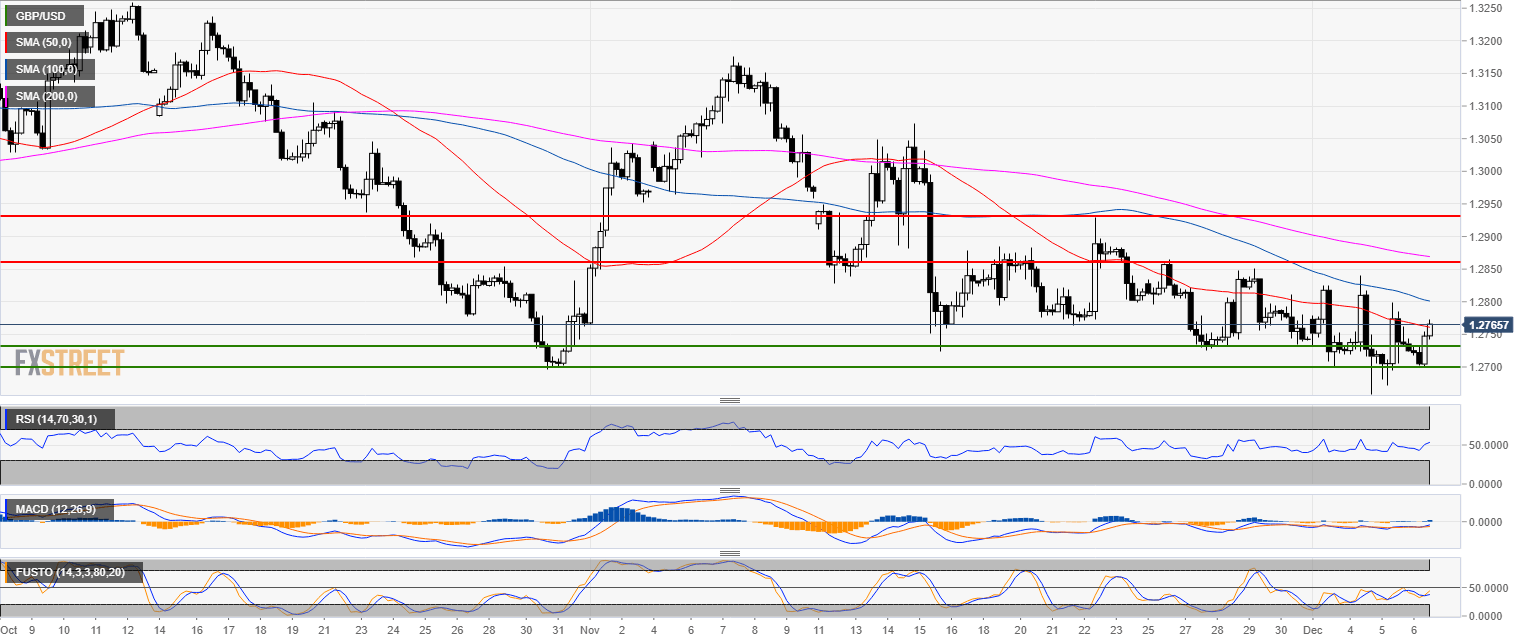
GBP/USD 4-hour chart
- GBP/USD is trading below its 100 and 200 SMAs.
- GBP/USD is essentially in a trading range with a downward slope.
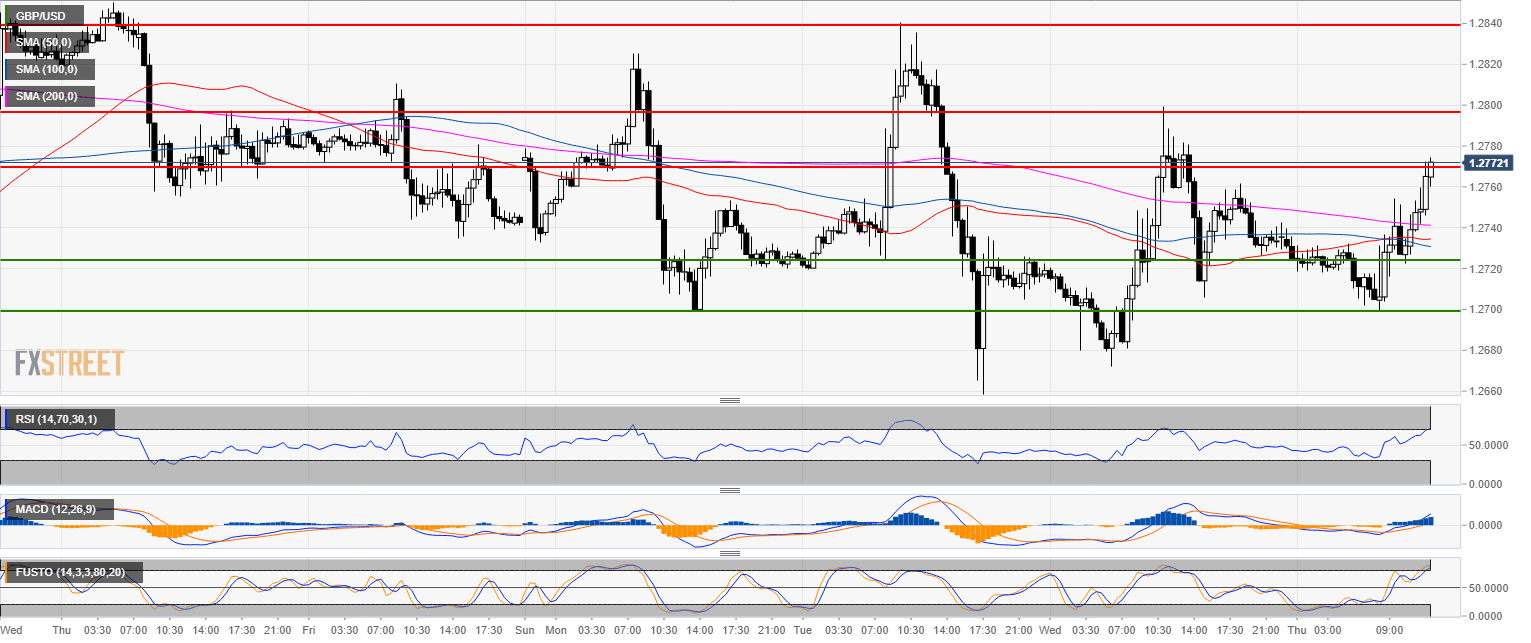
GBP/USD 30-minute chart
- The level to beat for bulls is 1.2770 then 1.2800 figure and 1.2840 become the next resistances.
- GBP/USD bulls were able to reclaim the main SMAs suggesting that 1.2800 can be on the cards this Thursday.
Additional key levels
GBP/USD
Overview:
Today Last Price: 1.2767
Today Daily change: 36 pips
Today Daily change %: 0.283%
Today Daily Open: 1.2731
Trends:
Previous Daily SMA20: 1.2831
Previous Daily SMA50: 1.2944
Previous Daily SMA100: 1.2964
Previous Daily SMA200: 1.3298
Levels:
Previous Daily High: 1.2798
Previous Daily Low: 1.2672
Previous Weekly High: 1.2864
Previous Weekly Low: 1.2725
Previous Monthly High: 1.3176
Previous Monthly Low: 1.2723
Previous Daily Fibonacci 38.2%: 1.275
Previous Daily Fibonacci 61.8%: 1.272
Previous Daily Pivot Point S1: 1.2669
Previous Daily Pivot Point S2: 1.2608
Previous Daily Pivot Point S3: 1.2543
Previous Daily Pivot Point R1: 1.2796
Previous Daily Pivot Point R2: 1.286
Previous Daily Pivot Point R3: 1.2922
