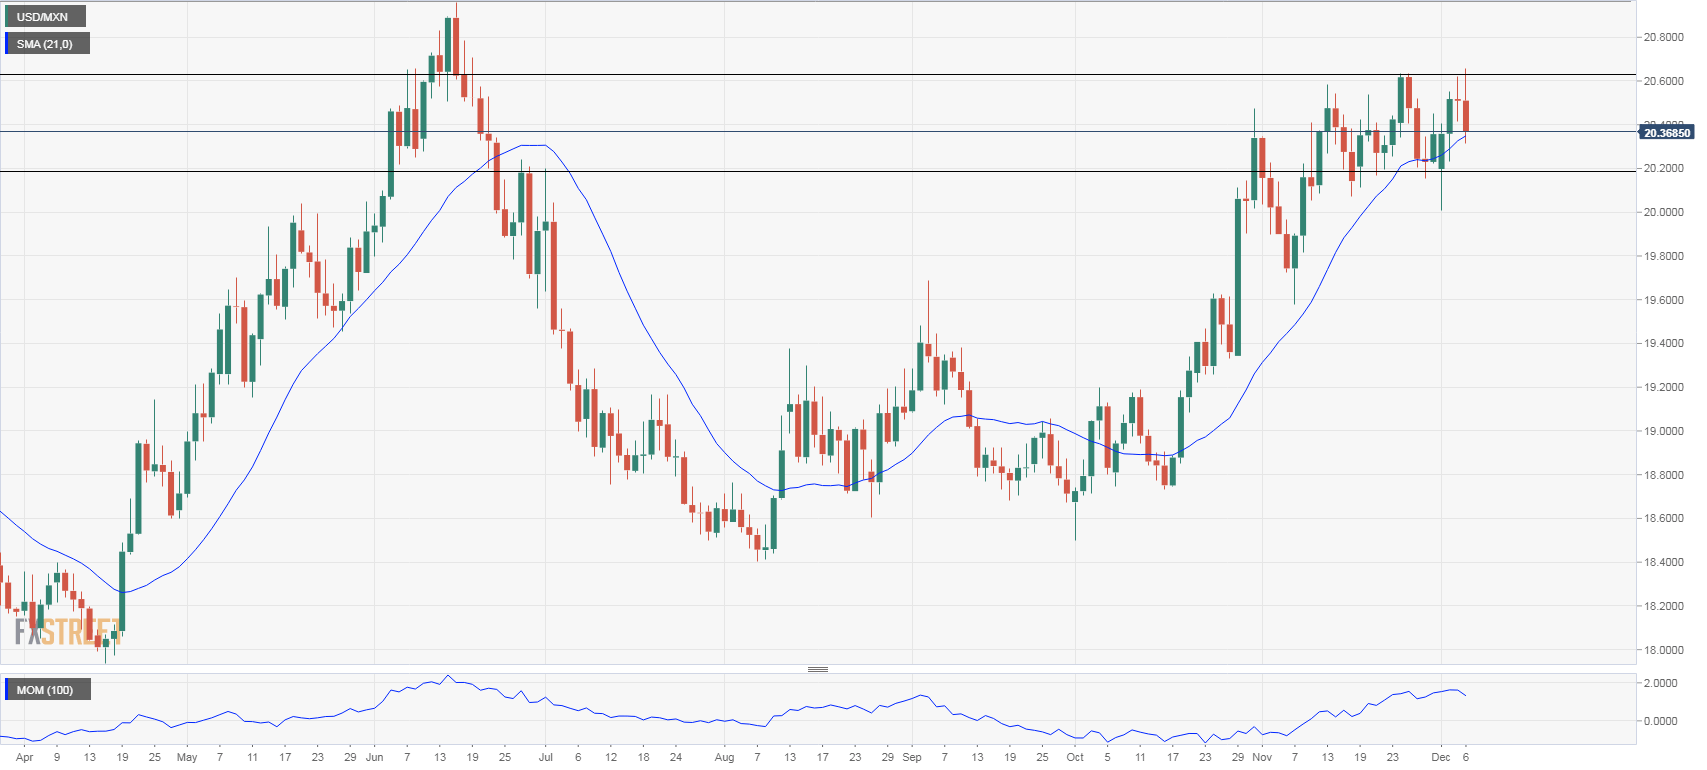
- The USD/MXN hit earlier today at 20.65, the highest level since June but then pulled back making a reversal. The momentum indicator turned to the downside and price dropped to test the 20-day moving average, showing lack of strength so far for a move above 20.65.
- A daily close above 20.50 could reinforce the bullish trend, but a breakout on top of 20.65 is needed to open the doors to further gains.
- After today’s reversal and the failure at 20.60, the Mexican peso could recover further, particularity if the pair drops firmly under 20.35 (20-day moving average). The next support to watch is 20.20; below the 20.00 area would be exposed.
- The main trend still points to the upside in USD/MXN, but the US dollar positive tone in the short-term eased after today’s reversal, and now the bias is skewed toward an extension of the bearish correction.
USD/MXN Daily Chart
USD/MXN
Overview:
Today Last Price: 20.3748
Today Daily change %: -0.657%
Today Daily Open: 20.5096
Trends:
Previous Daily SMA20: 20.349
Previous Daily SMA50: 19.724
Previous Daily SMA100: 19.3117
Previous Daily SMA200: 19.2546
Levels:
Previous Daily High: 20.6183
Previous Daily Low: 20.417
Previous Weekly High: 20.6355
Previous Weekly Low: 20.156
Previous Monthly High: 20.6355
Previous Monthly Low: 19.576
Previous Daily Fibonacci 38.2%: 20.4939
Previous Daily Fibonacci 61.8%: 20.5414
Previous Daily Pivot Point S1: 20.4117
Previous Daily Pivot Point S2: 20.3137
Previous Daily Pivot Point S3: 20.2103
Previous Daily Pivot Point R1: 20.613
Previous Daily Pivot Point R2: 20.7163
Previous Daily Pivot Point R3: 20.8143
