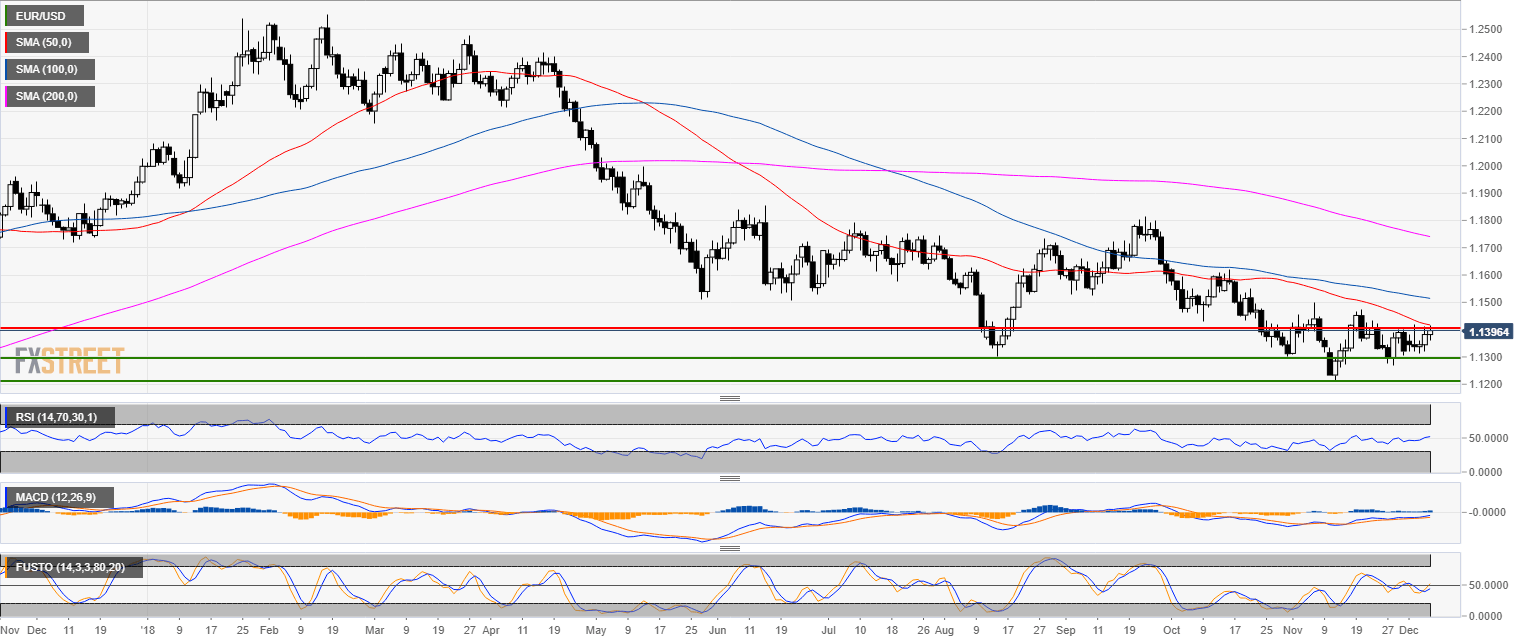
EUR/USD daily chart
- EUR/USD is in a bear trend below the 200-day simple moving average (SMA).
- The US Nonfarm Payrolls (NFP) came in worse-than-expected at 155K vs. 200K expected helping EUR/USD to rise to the 1.1400 figure and the 50 SMA.
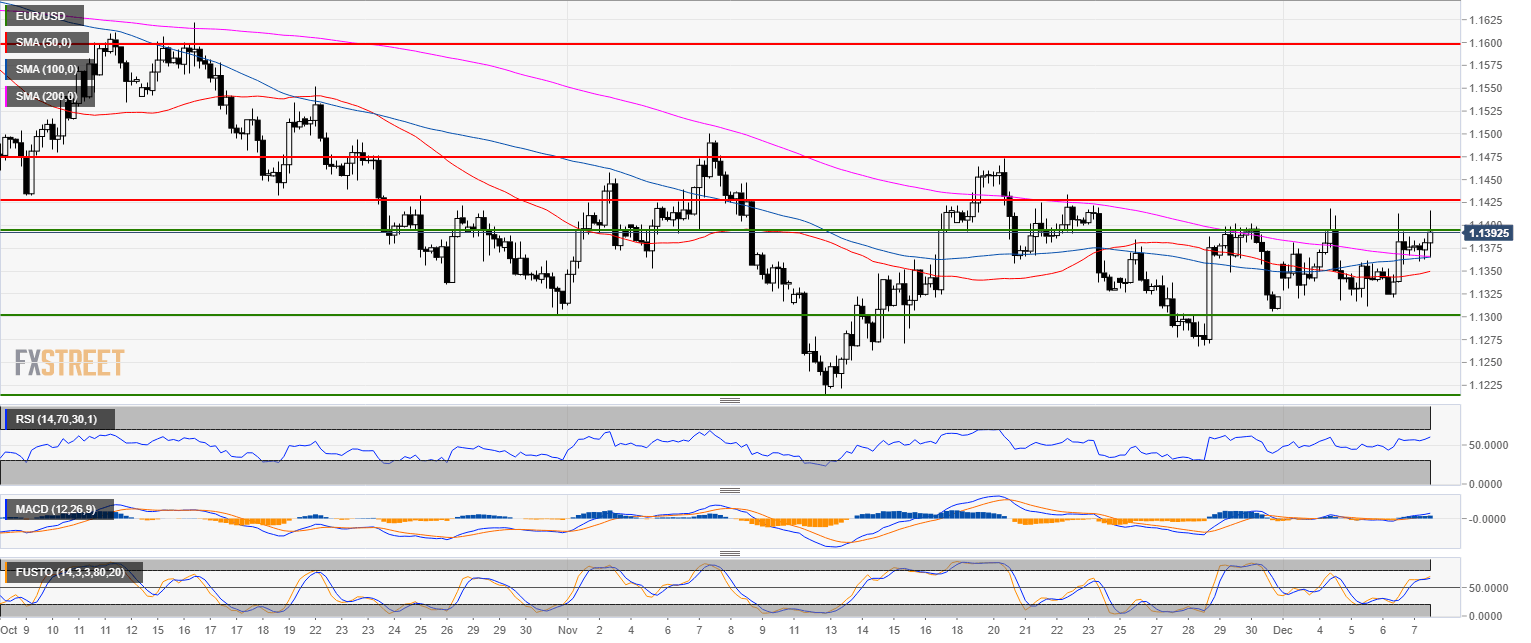
EUR/USD 4-hour chart
- EUR/USD is trading above the 50, 100 and 200 SMAs.
- If the 1.1400 resistance breaks, EUR/USD can have a potential continuation up to1.1475 and 1.1600 figure in the coming weeks.
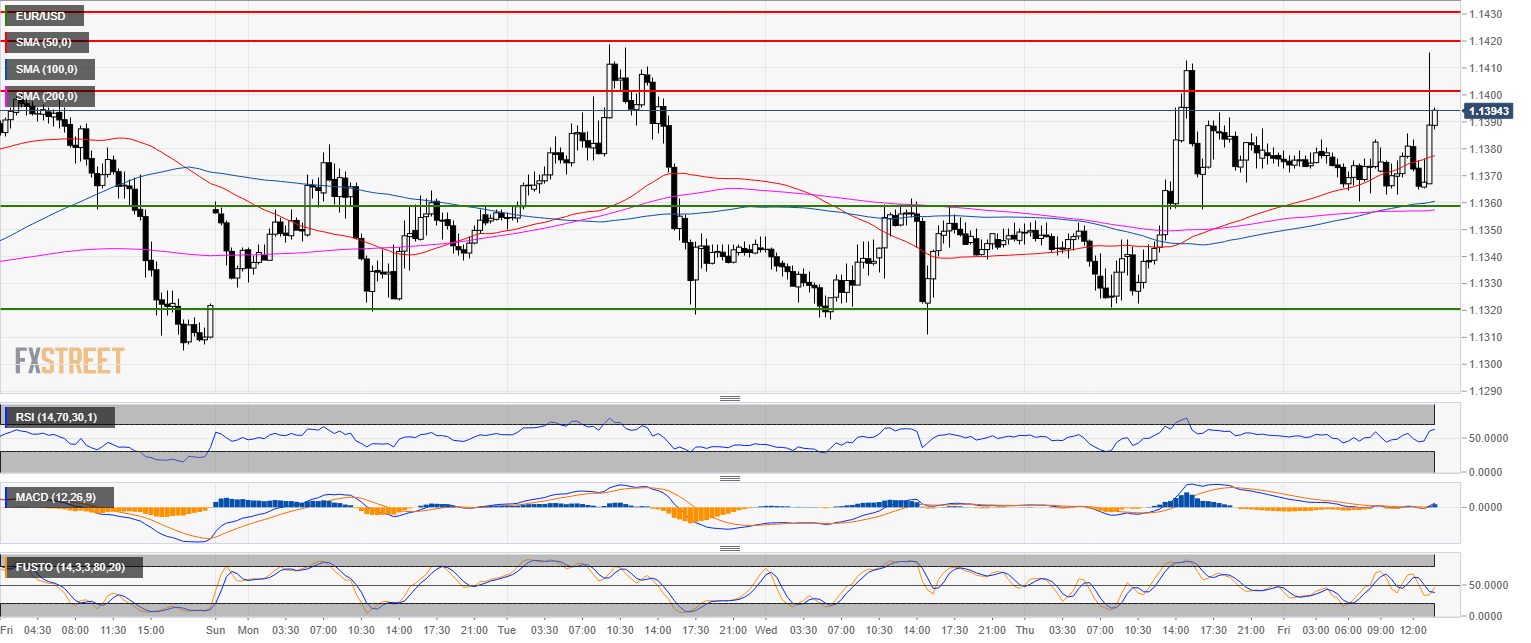
EUR/USD 30-minute chart
- EUR/USD is holding gains above the 1.1360 level.
- The bias should remain to the upside as long as the 1.1360 support holds.
Additional key levels
EUR/USD
Overview:
Today Last Price: 1.138
Today Daily change: -2.0 pips
Today Daily change %: -0.0176%
Today Daily Open: 1.1382
Trends:
Previous Daily SMA20: 1.1349
Previous Daily SMA50: 1.1421
Previous Daily SMA100: 1.1518
Previous Daily SMA200: 1.1746
Levels:
Previous Daily High: 1.1413
Previous Daily Low: 1.1321
Previous Weekly High: 1.1402
Previous Weekly Low: 1.1267
Previous Monthly High: 1.15
Previous Monthly Low: 1.1216
Previous Daily Fibonacci 38.2%: 1.1378
Previous Daily Fibonacci 61.8%: 1.1356
Previous Daily Pivot Point S1: 1.1331
Previous Daily Pivot Point S2: 1.128
Previous Daily Pivot Point S3: 1.124
Previous Daily Pivot Point R1: 1.1423
Previous Daily Pivot Point R2: 1.1464
Previous Daily Pivot Point R3: 1.1515
