- EUR/USD risk reversals jumped to the highest since June 7, indicating falling demand for puts (bearish bets).
- Eurozone third quarter GDP, due for release at 10:00 GMT, is expected to show that growth rate remained unchanged.
- A better-than-expected US average weekly earnings could push up Treasury yields and the US dollar.
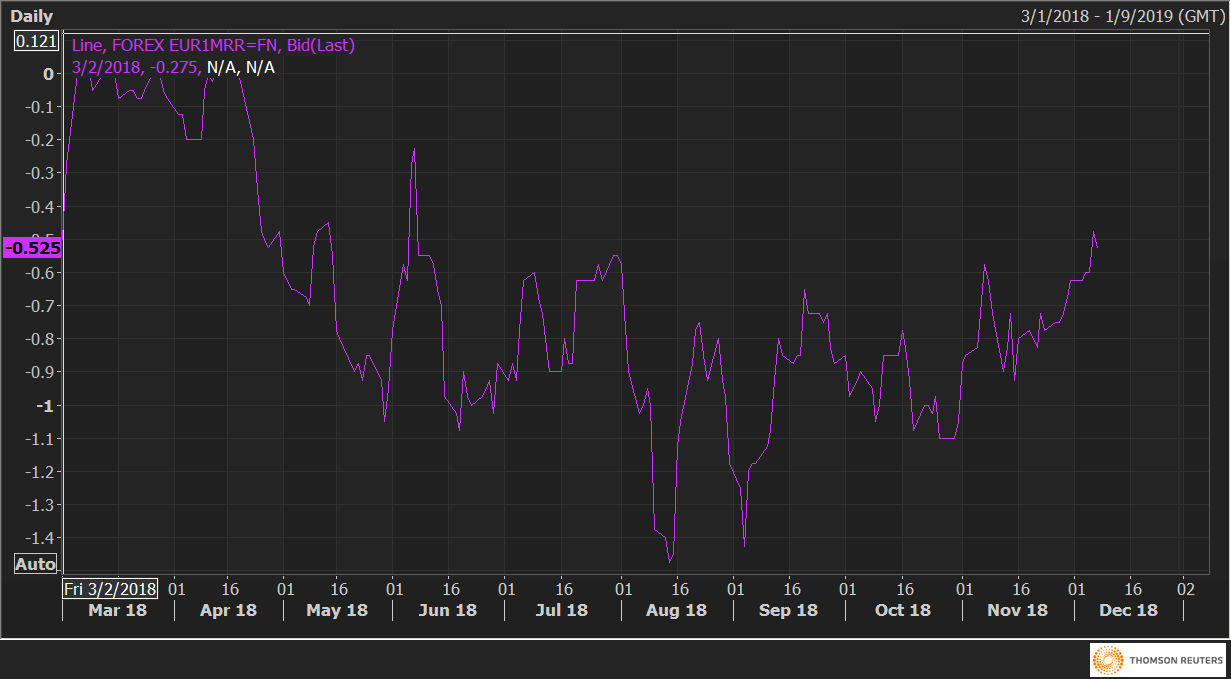
Risk reversals on the EUR, a gauge of calls to puts on the common currency, rose to six-month highs on Thursday, indicating investors are trimming bearish bets in anticipation of a stronger rally.
The one-month 25 delta risk reversals (EUR1MRR) rose to -0.475 – the highest level since June 7. The negative print indicates the implied volatility premium (or demand) for the puts (bearish bets) is higher than that for calls (bullish bets).
The value for the puts, however, is at the lowest in six months. Notably, it has dropped sharply in the last three weeks – risk reversals stood at -0.925 on Nov. 15.
So, it seems safe to say that investors are likely expecting the EUR/USD to confirm a symmetrical triangle breakout with a move above 1.1433 (upper edge of the triangle) and hence are unwinding bearish positions.
The bullish move could happen today if the Eurozone GDP prints above estimates and more importantly, the US wage growth cools sharply, forcing the markets to price in a 2019 rate pause. As of now, markets are expecting the Fed to deliver one rate hike next year.
The bull breakout, however, will likely remain elusive if the US wage growth number blows past expectations, pushing the treasury yields higher. The dollar may also remain bid if equities remain risk-averse.
EUR1MRR
EUR/USD Technical Levels
EUR/USD
Overview:
Today Last Price: 1.1375
Today Daily change: -7.0 pips
Today Daily change %: -0.0615%
Today Daily Open: 1.1382
Trends:
Previous Daily SMA20: 1.1349
Previous Daily SMA50: 1.1421
Previous Daily SMA100: 1.1518
Previous Daily SMA200: 1.1746
Levels:
Previous Daily High: 1.1413
Previous Daily Low: 1.1321
Previous Weekly High: 1.1402
Previous Weekly Low: 1.1267
Previous Monthly High: 1.15
Previous Monthly Low: 1.1216
Previous Daily Fibonacci 38.2%: 1.1378
Previous Daily Fibonacci 61.8%: 1.1356
Previous Daily Pivot Point S1: 1.1331
Previous Daily Pivot Point S2: 1.128
Previous Daily Pivot Point S3: 1.124
Previous Daily Pivot Point R1: 1.1423
Previous Daily Pivot Point R2: 1.1464
Previous Daily Pivot Point R3: 1.1515
