- Gold is currently trading at $1,238 per Oz, having clocked a high of $1,244.40 – the level last seen on July 17.
- Notably, it has charted a pennant pattern on the 4-hour chart. A break above the upper edge of the pennant, currently at $1,240 would signal a continuation of the rally from the Nov. 30 low of $1,216 (pole low) and would open up upside toward $1,268 (target as per the measured height method).
- A pennant breakdown – move below $1,235 – if confirmed, would validate RSI’s breach of the ascending trendline and could yield a drop to $1,228 (ascending 50-candle simple moving average).
4-Hour Chart
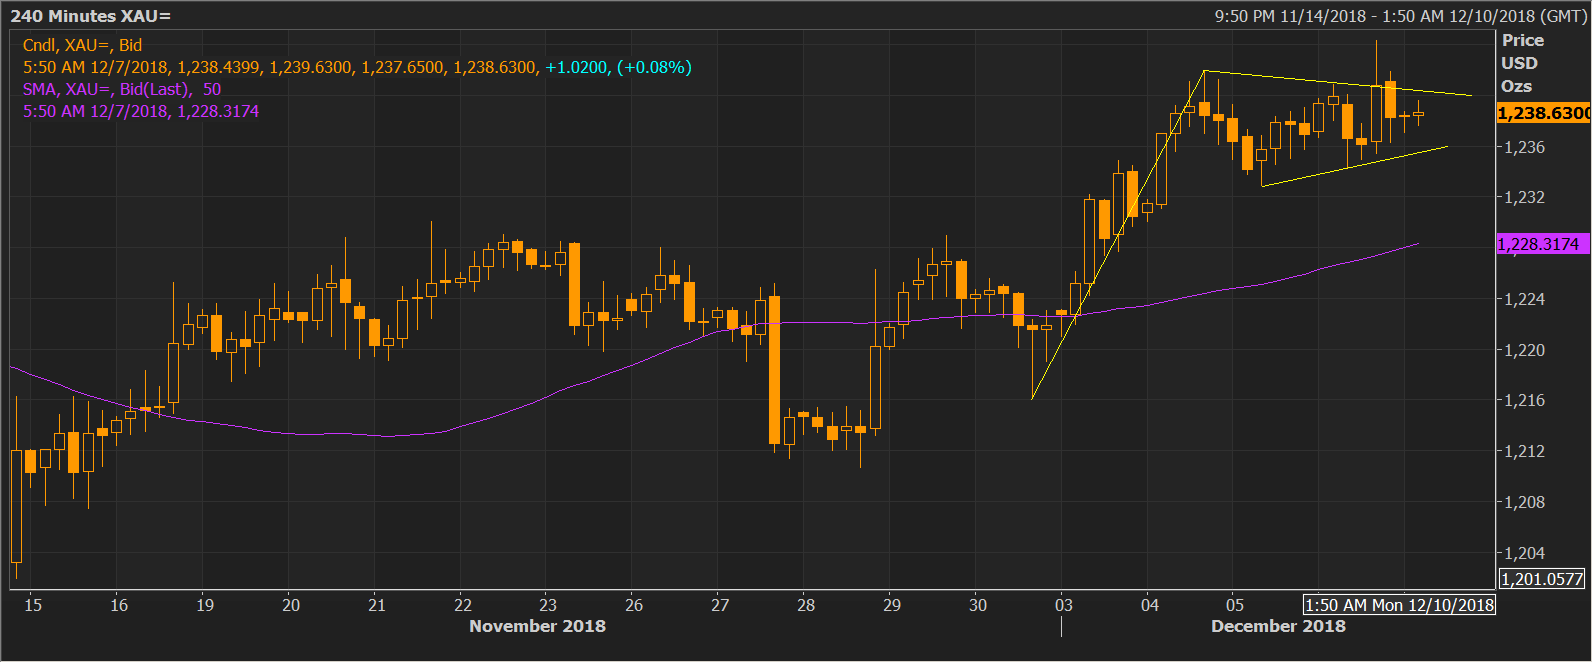
Trend: Bullish above $1,240
XAU/USD
Overview:
Today Last Price: 1238.7
Today Daily change: 52 pips
Today Daily change %: 0.0420%
Today Daily Open: 1238.18
Trends:
Previous Daily SMA20: 1221.84
Previous Daily SMA50: 1223.52
Previous Daily SMA100: 1210.9
Previous Daily SMA200: 1232.92
Levels:
Previous Daily High: 1244.35
Previous Daily Low: 1232.8
Previous Weekly High: 1231.8
Previous Weekly Low: 1211.2
Previous Monthly High: 1237.4
Previous Monthly Low: 1196.4
Previous Daily Fibonacci 38.2%: 1239.94
Previous Daily Fibonacci 61.8%: 1237.21
Previous Daily Pivot Point S1: 1232.54
Previous Daily Pivot Point S2: 1226.89
Previous Daily Pivot Point S3: 1220.99
Previous Daily Pivot Point R1: 1244.09
Previous Daily Pivot Point R2: 1249.99
Previous Daily Pivot Point R3: 1255.64
